Instruments Tutorial with Swift: Getting Started
In this Xcode tutorial, you’ll learn how to use Instruments to profile and debug performance, memory and reference issues in your iOS apps. By Lea Marolt Sonnenschein.
Allocations, Allocations, Allocations
So what bug will you track down next?
There’s something hidden in the project that you probably haven’t spotted yet. You’ve likely heard about memory leaks. But what you may not know is that there are actually two kinds of leaks:
Even with Swift and ARC helping manage memory, the most common kind of memory leak is a retain cycle, or strong reference cycle. This occurs when two objects hold strong references to one another so that each object keeps the other one from being deallocated. As a result, their memory is never released.
-
True memory leaks: These occur when an object is no longer referenced by anything but is still allocated. That means the memory can never be reused.
Even with Swift and ARC helping manage memory, the most common kind of memory leak is a retain cycle, or strong reference cycle. This occurs when two objects hold strong references to one another so that each object keeps the other one from being deallocated. As a result, their memory is never released.
- Unbounded memory growth: This occurs when memory is allocated continuously and never given a chance to be deallocated. If this continues unchecked, you’ll run out of memory. On iOS, this means the system will terminate your app.
Now you’re going to explore the Allocations instrument. This instrument gives you detailed information about all the objects your app creates and the memory that backs them. It also shows you retain counts of each object.
Instrumenting Allocations
To start fresh with a new instruments profile, quit the Instruments app. Don’t worry about saving this particular run. Press Command-I in Xcode, select Allocations from the list and press Choose.

After a moment, you’ll see the Allocations instrument. It should look familiar because it looks a lot like Time Profiler.

Click the record button in the top-left corner to run the app. For the purposes of this tutorial, only pay attention to the All Heap and Anonymous VM track.

With Allocations running, perform five different searches in the app.
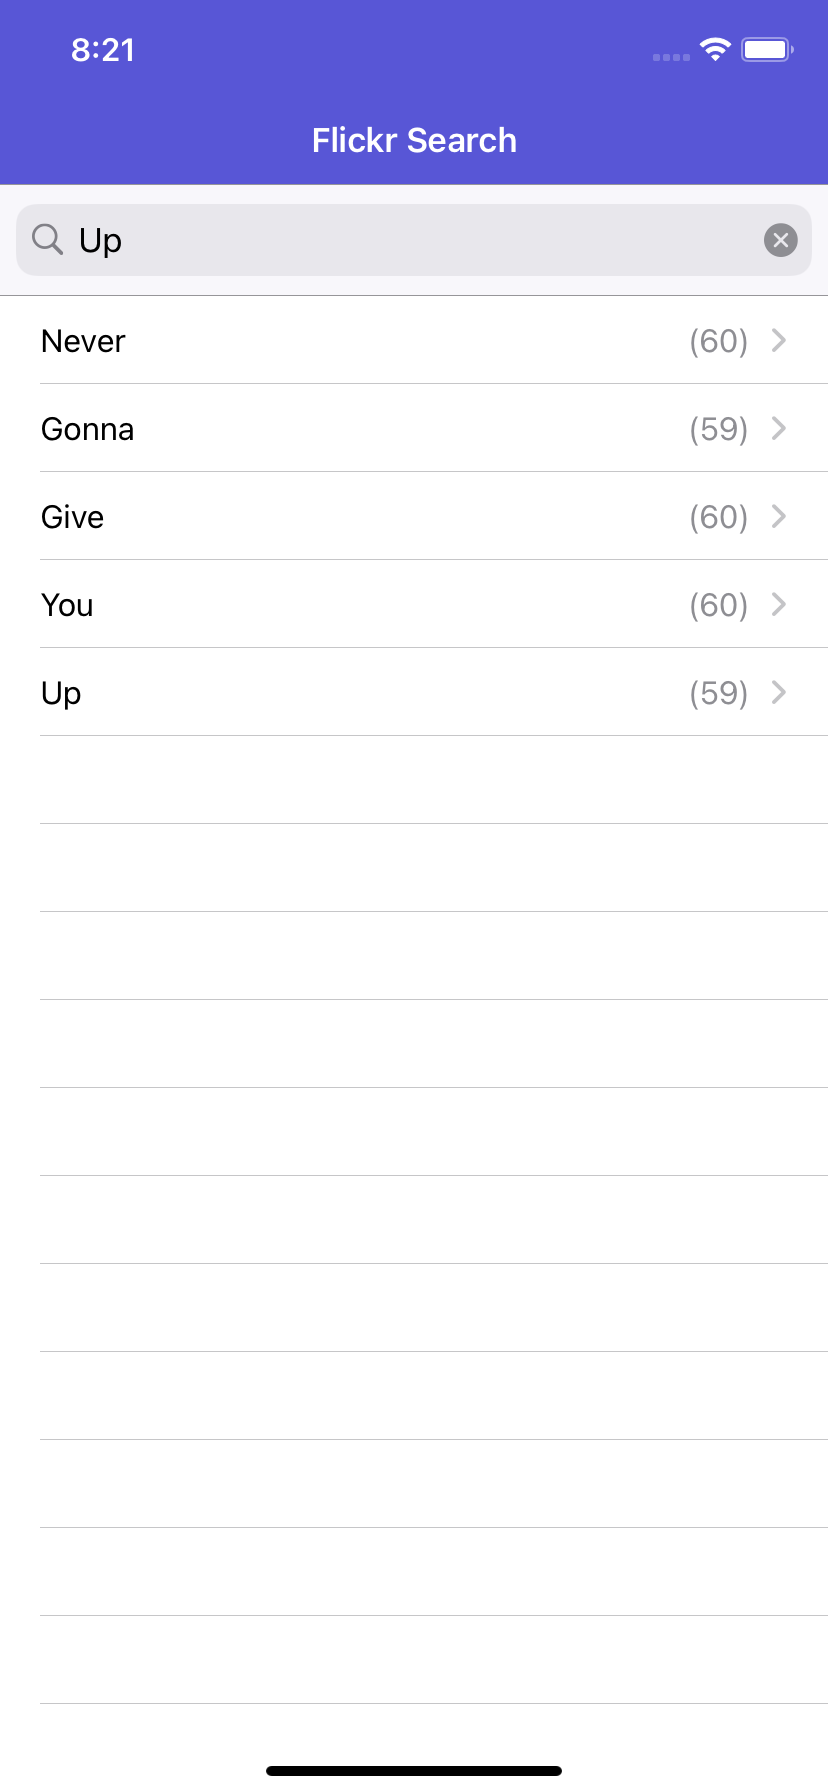
Make sure the searches have some results, and let the app settle a bit by waiting a few seconds.
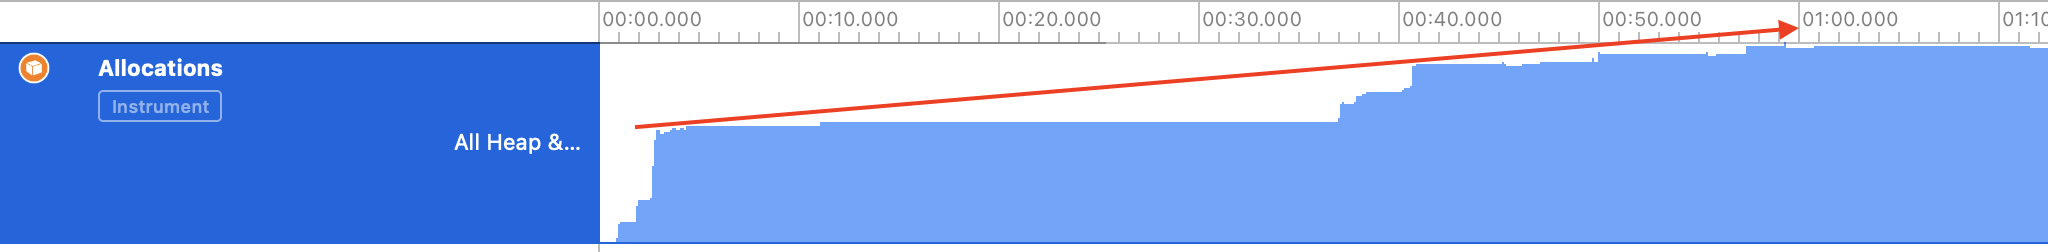
Did you notice the graph in the All Heap and Anonymous VM track has been rising? This tells you the app is allocating memory. This feature will guide you in finding unbounded memory growth.
Generation Analysis
What you’re going to perform is a generation analysis. To do this, click the button at the bottom of the detail panel labeled Mark Generation:
![]()
You’ll see a red flag appear in the track, like so:
![]()
The purpose of generation analysis is to perform an action multiple times and see if memory is growing in an unbounded fashion. Open the results of a search, wait a few seconds for the images to load, and then go back to the main page. Mark the generation again. Do this repeatedly for different searches.
After examining several searches, Instruments will look like this:

Are you getting suspicious? Notice how the blue graph goes up with each search. That isn’t good. But wait, what about memory warnings? You know about those, right?
Simulating a Memory Warning
Memory warnings are a way for iOS to tell an app that things are getting tight in the memory department and that you need to clear out some memory.
It’s possible this growth isn’t due to your app alone. It could be something in the depths of UIKit that’s holding onto memory. Give the system frameworks and your app a chance to clear their memory first before pointing a finger at either one.
Simulate a memory warning by selecting Document ▸ Simulate Memory Warning in Instruments’ menu bar, or Debug ▸ Simulate Memory Warning from the simulator’s menu bar. You’ll see memory use dips a little or not at all — certainly not back to where it should be. So there’s still unbounded memory growth happening somewhere.
You marked a generation after each iteration of examining a search so you can see what memory is allocated between each generation. Take a look in the detail panel and you’ll see a bunch of generations.
Within each generation, you’ll see all the objects that were allocated and still resident at the time that generation was marked. Subsequent generations will only contain the objects since the previous generation was marked.
Look at the Growth column and you’ll see there’s definitely growth occurring somewhere. Open one of the generations and you’ll see the following:

Wow, there are a lot of objects! Where do you start?
Easy. Click the Growth header to sort by size. Make sure the heaviest objects are at the top. Near the top of each generation, you’ll notice a row labeled VM: CoreImage, which sounds familiar! Click the arrow to the left of VM: CoreImage to display the memory addresses associated with this item. Select the first memory address to display the associated stack trace in the Extended Detail inspector on the panel to the right:

This stack trace shows you the point when this specific object was created. The parts of the stack trace in gray are in system libraries. The parts in black are in your app’s code.
Hmm, something looks familiar: Some of the black entries show your old friend collectionView(_:cellForItemAt:). Double-click on any of those entries and Instruments will bring up the code in its context.
Take a look through the method. It calls set(_:forKey:) on ImageCache.shared. Remember, this method caches an image in case it’s used again in the app. That sounds like it could be a problem!
Again, click Open in Xcode to jump back into Xcode. Open Cache.swift and take a look at the implementation of set(_:forKey:):
func set(_ image: UIImage, forKey key: String) {
  images[key] = image
}
This adds an image to a dictionary, keyed on the photo ID of the Flickr photo. But you’ll notice the image is never cleared from that dictionary!
That’s where your unbounded memory growth is coming from. Everything is working as it should, but the app never removes things from the cache — it only ever adds them!
To fix the problem, have ImageCache listen for the memory warning notification UIApplication fires. When ImageCache receives this, it must be a good citizen and clear its cache.
To make ImageCache listen for the notification, open Cache.swift and add the following initializer to the class:
init() {
  NotificationCenter.default.addObserver(
    forName: UIApplication.didReceiveMemoryWarningNotification,
    object: nil,
    queue: .main) { [weak self] _ in
      self?.images.removeAll(keepingCapacity: false)
  }
}
This registers an observer for UIApplication.didReceiveMemoryWarningNotification to execute a closure that clears images.
All the code needs to do is remove all objects in the cache. This ensures nothing is holding onto the images anymore and they’ll be deallocated.
To test this fix, fire up Instruments again and repeat the steps you followed before. Don’t forget to simulate a memory warning at the end.
This time, the generation analysis should look like this:

You’ll notice the memory usage dropped after the memory warning. There’s still some memory growth, but nowhere near as much as before.
The reason there’s still some growth is due to the system libraries, and there’s not much you can do about those. It appears the system libraries aren’t freeing all their memory, which may be by design or may be a bug. All you can do in your app is free up as much memory as possible, and you’ve already done that!
Well done! One more issue patched up! It must be time to ship by now! Oh, wait — there’s still the issue of the first type of leak that you haven’t yet addressed.