Instruments Tutorial with Swift: Getting Started
In this Xcode tutorial, you’ll learn how to use Instruments to profile and debug performance, memory and reference issues in your iOS apps. By Lea Marolt Sonnenschein.
Sign up/Sign in
With a free Kodeco account you can download source code, track your progress, bookmark, personalise your learner profile and more!
Create accountAlready a member of Kodeco? Sign in
Sign up/Sign in
With a free Kodeco account you can download source code, track your progress, bookmark, personalise your learner profile and more!
Create accountAlready a member of Kodeco? Sign in
Sign up/Sign in
With a free Kodeco account you can download source code, track your progress, bookmark, personalise your learner profile and more!
Create accountAlready a member of Kodeco? Sign in
Contents
Instruments Tutorial with Swift: Getting Started
40 mins
- Getting Started
- Time for Profiling
- Instrumenting
- Drilling Deep
- Offloading the Work
- Allocations, Allocations, Allocations
- Instrumenting Allocations
- Generation Analysis
- Simulating a Memory Warning
- Strong Reference Cycles
- Finding Persistent Objects
- Getting Visual
- Breaking That Cycle
- Where to Go From Here?
In addition to improving their apps by adding features, there’s one thing all good app developers should do: instrument their code! This Xcode Instruments tutorial will show you how to use the most important features of the Instruments tool that ships with Xcode.
In this tutorial, you’ll learn:
- What Instruments is and what tools it contains
- Ways of configuring and customizing your instruments
- How to check your code for performance issues, memory issues, reference cycles and other problems
- The best way to debug these issues
You’ll do this by going through an existing app and improving it using Instruments — much like you would with your own apps!
Getting Started
Download the project materials using the Download Materials button at the top or bottom of this tutorial.
This sample app uses the Flickr API to search for images. To use the API, you need an API key. For demo projects, you can generate a sample key on Flickr’s website:
- Go to https://identity.flickr.com and either create a new Flickr account, or sign in with your existing account.
- Once signed in successfully, go to Flickr API Explorer.
- Find and click Call Method… at the bottom of the page.
- This will generate a URL link at the very bottom of the page that looks like:
https://www.flickr.com/services/rest/?method=flickr.photos.search &api_key=f0589d37afc0e29525f51ccb26932a06 &format=rest &auth_token=72157717064637163-20d89cb35333d1eb &api_sig=80ada3ca6dba49f7fcc9ced2743de537
- Copy the API key from the URL. You can find this by looking for the number between
&api_key=
and the next&
you see. In the above example, the API key isf0589d37afc0e29525f51ccb26932a06
.
To update the project, open FlickrAPI.swift and replace the existing API key value with your new value.
Build and run, perform a search, click the result and you’ll see something like this:
Play with the app and check out its basic functions. You might think that once the UI looks great, the app is ready for store submission. But you’re about to see the value that using Instruments can add to your app.
The rest of this tutorial shows you how to find and fix issues that still exist in the app. You’ll see how Instruments can make debugging problems much easier!
Time for Profiling
The first instrument you’ll look at is Time Profiler. At measured intervals, Instruments halts the execution of the program and takes a stack trace on each running thread. Think of it as clicking the pause button in Xcode’s debugger.
Here’s a sneak preview of Time Profiler:
This screen displays the Call Tree. The Call Tree shows the amount of time spent executing various methods within an app. Each row is a different method the program’s execution path has followed. The Instruments tool approximates the time spent in each method by counting the number of times the profiler stops in each method.
For instance, if you take 100 samples at 1 millisecond intervals and a particular method appears at the top of the stack in 10 samples, you can deduce that the app spent approximately 10% of the total execution time — 10 milliseconds — in that method. It’s a crude approximation, but it works!
So without any further ado, time to get instrumenting!
Instrumenting
From Xcode’s menu bar, select Product ▸ Profile or press Command-I. This builds the app and launches Instruments. You’ll see a selection window like this:
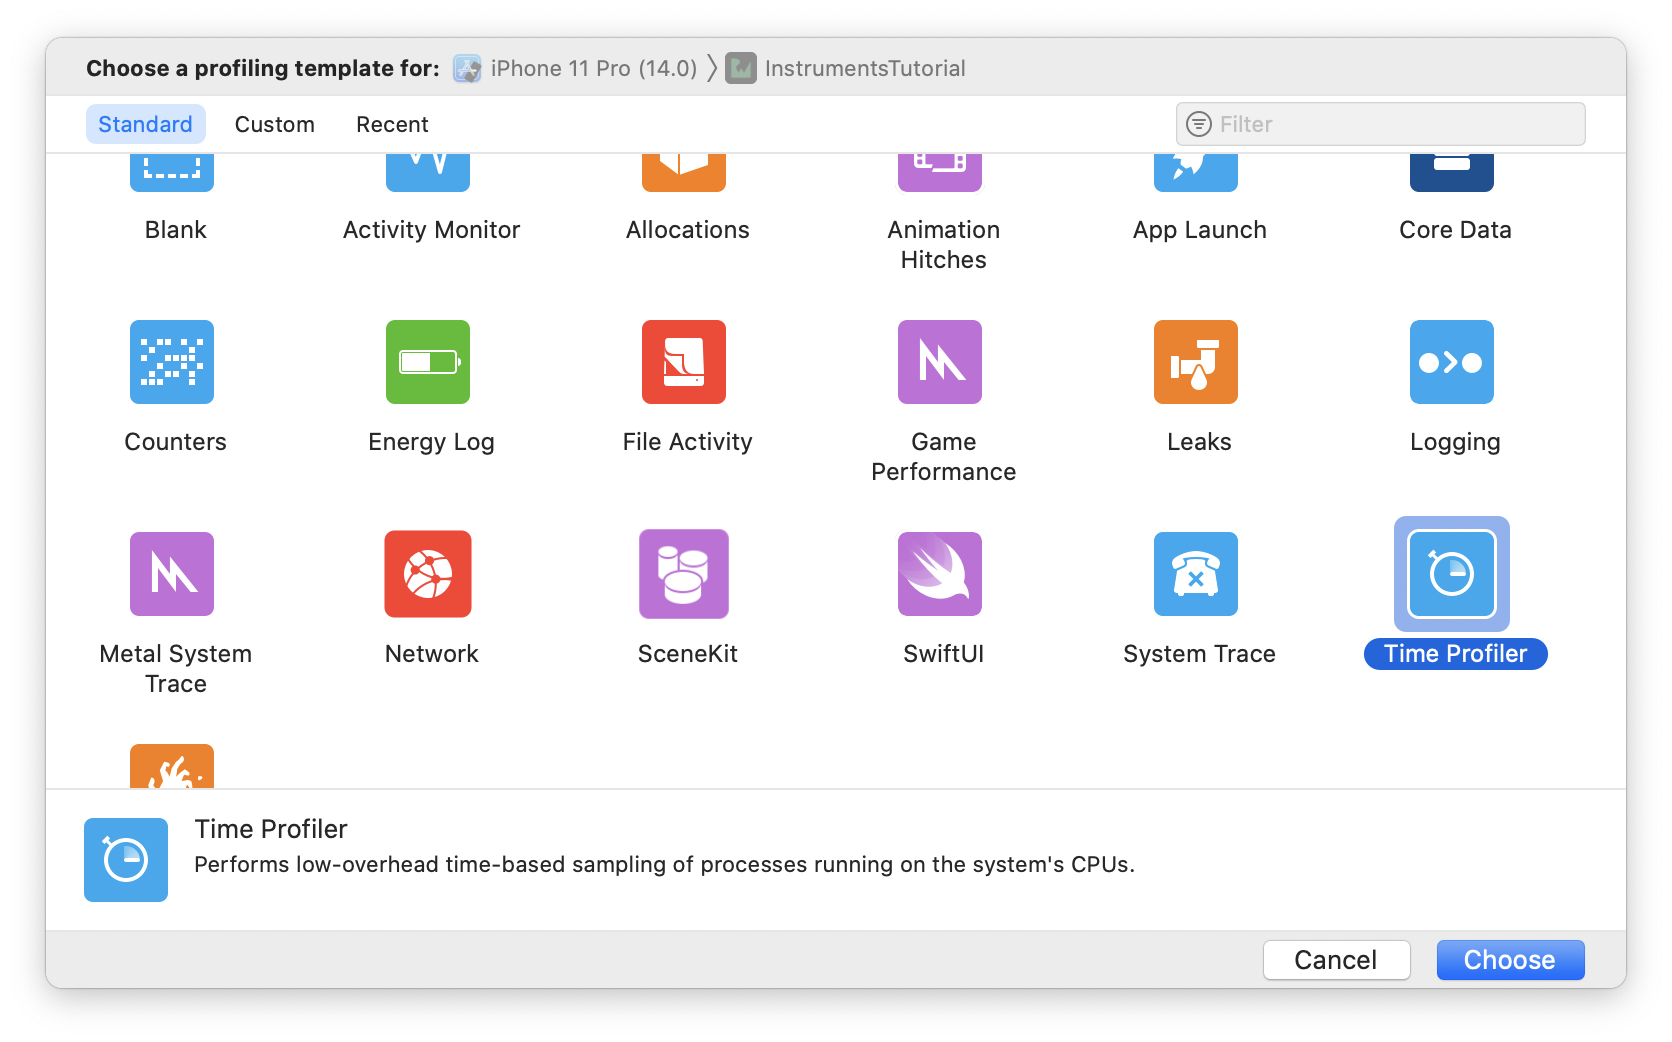
These are all different templates that come with Instruments.
Select the Time Profiler instrument and click Choose to open a new Instruments document. Click the record button at the top left to start recording and launch the app. macOS may ask for your password to authorize Instruments to analyze other processes. Fear not, it’s safe to provide here!
In the Instruments window, you can see the time counting up and a little arrow moving from left to right above the graph in the center of the screen. This indicates the app is running.
Now, start using the app. Search for some images, and drill down into one or more of the search results. You’ll notice that going into a search result is slow, and scrolling through a list of search results is annoying. It’s a clunky app!
Well, you’re in luck, as you’re about to embark on fixing it! But you’re first going to get a quick rundown of what you’re looking at in Instruments.
Make sure you have all the detail views open by toggling the view selectors on the right-hand side of the toolbar:
That ensures all panels are open. Now, study the screenshot below:
Here’s what you’re seeing:
- Recording controls: The record button stops and starts the app currently under test. The pause button pauses the current execution of the app.
- Run timer: The timer counts how long the profiled app has been running and how many times it has run. The above screenshot is the second run, Run 2 of 2.
- Instrument track: This is the Time Profiler track. You’ll learn more about the specifics of the graph later in the tutorial.
-
Detail panel: This shows the main information about the particular instrument you’re using. In this case, it shows the ones using the most CPU time.
At the top of the detail panel, click Profile and select Samples.
Here you can view every single sample. Click on a few samples; you’ll see the captured stack trace appear in the Extended Detail inspector to the right. Switch back to Profile when you’re done.
- Inspectors panel: There are two inspectors — Extended Detail and Run Info — which you’ll learn more about shortly.
Now that you have an overview, it’s time to dig in some more!
Drilling Deep
Perform an image search and drill into the results.
Scroll up and down the list a few times so that you’ve got a good amount of data in Time Profiler. Notice the numbers in the middle of the screen changing and the graph filling in. This tells you the app is using CPU cycles.
It may look subtle in the simulator, but notice the choppiness and how the scrolling staggers as you swipe up and and down. No collection view is ready to ship until it scrolls like butter!
To help pinpoint the problem, you’ll set some options. Click Stop, and below the detail panel, click Call Tree. In the popover that appears, select Separate by Thread, Invert Call Tree and Hide System Libraries.
Here’s what each option is doing to the data displayed in Detail panel:
- Separate by State: This option groups results by your app’s lifecycle state and is a useful way to inspect how much work your app is doing and when.
- Separate by Thread: This separates the threads and enables you to understand which threads are responsible for the greatest amount of CPU use.
- Invert Call Tree: This option shows the most recent frame first in the stack trace.
- Hide System Libraries: When you select this option, you’ll only see symbols from your own app. It’s often useful to select this option since you can’t do much about how much CPU the system libraries are using.
- Flatten Recursion: This option shows recursive functions — which are functions that call themselves — with one entry in each stack trace, rather than multiple times.
- Top Functions: Enabling this makes Instruments consider the total time spent in a function as the sum of the time within that function, as well as the time spent in functions called by that function. So if function A calls B, then Instruments reports A’s time as the time spent in A plus the time spent in B. This can be useful, as it lets you pick the largest time figure each time you descend into the call stack, zeroing in on your most time-consuming methods.
Scan the results to identify which rows have the highest percentage in the Weight column. The row with the Main Thread is using up a significant proportion of CPU cycles. Unfold this row by clicking the small arrow to the left of the text and keep looking until you see one of your own methods marked with the “person” symbol. Although some values may be different, the order of the entries should be similar to what’s shown in the table below:
Well, that doesn’t look good. The app spends the vast majority of time creating a UIImage with a “tonal” filter for the thumbnail photos. That shouldn’t come as too much of a shock to you, as the table loading and scrolling were the clunkiest parts of the UI, and that’s when the table cells were constantly being updated.
To find out more about what’s going on within that method, double-click its row in the table to pull up the following view:
withTonalFilter
is a property extension on UIImage
, and it spends a lot of time invoking the method that creates the CGImage
output after applying the image filter.
There’s not much you can do to speed this up. Creating the image is an intensive process and takes as long as it takes. Try stepping back to see where the app calls withTonalFilter
. Click Root in the breadcrumb trail at the top of the code view to get back to the previous screen:
Now click the small arrow to the left of the withTonalFilter
row at the top of the table. This will show the caller of withTonalFilter
— you may need to unfold the next row too. When profiling Swift, there will sometimes be duplicate rows in Call Tree which are prefixed with @objc
. You’re interested in the first row that’s prefixed with the “person” icon, which indicates it belongs to your app’s target:
In this case, this row refers to (_:cellForItemAt:)
in SearchResultsViewController.swift. Double-click the row to see the associated code from the project.
Now you can see what the problem is. Take a look at line 71: Creating a UIImage with the tonal filter takes a long time to execute, and you create it from collectionView(_:cellForItemAt:)
.
Offloading the Work
To solve this, you’ll do two things: First, offload the image filtering onto a background thread with DispatchQueue.global().async
. Second, cache each image after it’s generated. There’s a small, simple image caching class — with the catchy name ImageCache
— included in the starter project. It stores and retrieves images in memory with a given key.
You could now switch to Xcode and manually find the source file you’re looking at in Instruments. But there’s a handy Open in Xcode button in Instruments. Locate it in the panel above the code and click it:
There you go! Xcode opens at exactly the right place. Boom!
Now, within collectionView(_:cellForItemAt:)
, replace the call to loadThumbnail(for:completion:)
with the following:
ImageCache.shared.loadThumbnail(for: flickrPhoto) { result in
switch result {
case .success(let image):
if resultsCell.flickrPhoto == flickrPhoto {
if flickrPhoto.isFavorite {
resultsCell.imageView.image = image
} else {
// 1
if let cachedImage =
ImageCache.shared.image(forKey: "\(flickrPhoto.id)-filtered") {
resultsCell.imageView.image = cachedImage
} else {
// 2
DispatchQueue.global().async {
if let filteredImage = image.withTonalFilter {
ImageCache.shared
.set(filteredImage, forKey: "\(flickrPhoto.id)-filtered")
DispatchQueue.main.async {
resultsCell.imageView.image = filteredImage
}
}
}
}
}
}
case .failure(let error):
print("Error: \(error)")
}
}
The first section of this code is the same as it was before and loads the Flickr photo’s thumbnail image from the web. If the photo is a favorite, the cell displays the thumbnail without modification. However, if the photo isn’t a favorite, it applies the tonal filter.
This is where you change things:
- Check to see if a filtered image for this photo exists in the image cache. If yes, display that image.
- If not, dispatch the call to create an image with the tonal filter onto a background queue. This allows the UI to remain responsive while the filter runs. When the filter completes, save the image in the cache and update the image view on the main queue.
This takes care of the filtered images, but there are still the original Flickr thumbnails to resolve. Open Cache.swift and find loadThumbnail(for:completion:)
. Replace it with the following:
func loadThumbnail(
for photo: FlickrPhoto,
completion: @escaping FlickrAPI.FetchImageCompletion
) {
if let image = ImageCache.shared.image(forKey: photo.id) {
completion(Result.success(image))
} else {
FlickrAPI.loadImage(for: photo, withSize: "m") { result in
if case .success(let image) = result {
ImageCache.shared.set(image, forKey: photo.id)
}
completion(result)
}
}
}
This is similar to how you handled filtered images. If an image already exists in the cache, call the completion closure straight away with the cached image. Otherwise, load the image from Flickr and store it in the cache.
Press Command-I to run the app in Instruments again. Notice this time Xcode doesn’t ask you which instrument to use. This is because you still have a window open for your app, and Instruments assumes you want to run again with the same options.
Perform a few more searches. The UI is not as clunky now! The app now applies the image filter in the background and caches the result, so images only have to be filtered once. You’ll see many dispatch_worker_threads in the Call Tree. These handle the heavy lifting of applying image filters.
Looks great! Is it time to ship it? Not yet!
Allocations, Allocations, Allocations
So what bug will you track down next?
There’s something hidden in the project that you probably haven’t spotted yet. You’ve likely heard about memory leaks. But what you may not know is that there are actually two kinds of leaks:
-
True memory leaks: These occur when an object is no longer referenced by anything but is still allocated. That means the memory can never be reused.
Even with Swift and ARC helping manage memory, the most common kind of memory leak is a retain cycle, or strong reference cycle. This occurs when two objects hold strong references to one another so that each object keeps the other one from being deallocated. As a result, their memory is never released.
- Unbounded memory growth: This occurs when memory is allocated continuously and never given a chance to be deallocated. If this continues unchecked, you’ll run out of memory. On iOS, this means the system will terminate your app.
Now you’re going to explore the Allocations instrument. This instrument gives you detailed information about all the objects your app creates and the memory that backs them. It also shows you retain counts of each object.
Instrumenting Allocations
To start fresh with a new instruments profile, quit the Instruments app. Don’t worry about saving this particular run. Press Command-I in Xcode, select Allocations from the list and press Choose.
After a moment, you’ll see the Allocations instrument. It should look familiar because it looks a lot like Time Profiler.
Click the record button in the top-left corner to run the app. For the purposes of this tutorial, only pay attention to the All Heap and Anonymous VM track.
With Allocations running, perform five different searches in the app.
Make sure the searches have some results, and let the app settle a bit by waiting a few seconds.
Did you notice the graph in the All Heap and Anonymous VM track has been rising? This tells you the app is allocating memory. This feature will guide you in finding unbounded memory growth.
Generation Analysis
What you’re going to perform is a generation analysis. To do this, click the button at the bottom of the detail panel labeled Mark Generation:
You’ll see a red flag appear in the track, like so:
The purpose of generation analysis is to perform an action multiple times and see if memory is growing in an unbounded fashion. Open the results of a search, wait a few seconds for the images to load, and then go back to the main page. Mark the generation again. Do this repeatedly for different searches.
After examining several searches, Instruments will look like this:
Are you getting suspicious? Notice how the blue graph goes up with each search. That isn’t good. But wait, what about memory warnings? You know about those, right?
Simulating a Memory Warning
Memory warnings are a way for iOS to tell an app that things are getting tight in the memory department and that you need to clear out some memory.
It’s possible this growth isn’t due to your app alone. It could be something in the depths of UIKit that’s holding onto memory. Give the system frameworks and your app a chance to clear their memory first before pointing a finger at either one.
Simulate a memory warning by selecting Document ▸ Simulate Memory Warning in Instruments’ menu bar, or Debug ▸ Simulate Memory Warning from the simulator’s menu bar. You’ll see memory use dips a little or not at all — certainly not back to where it should be. So there’s still unbounded memory growth happening somewhere.
You marked a generation after each iteration of examining a search so you can see what memory is allocated between each generation. Take a look in the detail panel and you’ll see a bunch of generations.
Within each generation, you’ll see all the objects that were allocated and still resident at the time that generation was marked. Subsequent generations will only contain the objects since the previous generation was marked.
Look at the Growth column and you’ll see there’s definitely growth occurring somewhere. Open one of the generations and you’ll see the following:
Wow, there are a lot of objects! Where do you start?
Easy. Click the Growth header to sort by size. Make sure the heaviest objects are at the top. Near the top of each generation, you’ll notice a row labeled VM: CoreImage, which sounds familiar! Click the arrow to the left of VM: CoreImage to display the memory addresses associated with this item. Select the first memory address to display the associated stack trace in the Extended Detail inspector on the panel to the right:
This stack trace shows you the point when this specific object was created. The parts of the stack trace in gray are in system libraries. The parts in black are in your app’s code.
Hmm, something looks familiar: Some of the black entries show your old friend collectionView(_:cellForItemAt:)
. Double-click on any of those entries and Instruments will bring up the code in its context.
Take a look through the method. It calls set(_:forKey:)
on ImageCache.shared
. Remember, this method caches an image in case it’s used again in the app. That sounds like it could be a problem!
Again, click Open in Xcode to jump back into Xcode. Open Cache.swift and take a look at the implementation of set(_:forKey:)
:
func set(_ image: UIImage, forKey key: String) {
images[key] = image
}
This adds an image to a dictionary, keyed on the photo ID of the Flickr photo. But you’ll notice the image is never cleared from that dictionary!
That’s where your unbounded memory growth is coming from. Everything is working as it should, but the app never removes things from the cache — it only ever adds them!
To fix the problem, have ImageCache
listen for the memory warning notification UIApplication
fires. When ImageCache
receives this, it must be a good citizen and clear its cache.
To make ImageCache
listen for the notification, open Cache.swift and add the following initializer to the class:
init() {
NotificationCenter.default.addObserver(
forName: UIApplication.didReceiveMemoryWarningNotification,
object: nil,
queue: .main) { [weak self] _ in
self?.images.removeAll(keepingCapacity: false)
}
}
This registers an observer for UIApplication.didReceiveMemoryWarningNotification
to execute a closure that clears images
.
All the code needs to do is remove all objects in the cache. This ensures nothing is holding onto the images anymore and they’ll be deallocated.
To test this fix, fire up Instruments again and repeat the steps you followed before. Don’t forget to simulate a memory warning at the end.
This time, the generation analysis should look like this:
You’ll notice the memory usage dropped after the memory warning. There’s still some memory growth, but nowhere near as much as before.
The reason there’s still some growth is due to the system libraries, and there’s not much you can do about those. It appears the system libraries aren’t freeing all their memory, which may be by design or may be a bug. All you can do in your app is free up as much memory as possible, and you’ve already done that!
Well done! One more issue patched up! It must be time to ship by now! Oh, wait — there’s still the issue of the first type of leak that you haven’t yet addressed.
Strong Reference Cycles
As mentioned earlier, a strong reference cycle occurs when two objects hold strong references to each other, preventing both from being deallocated. You can detect these cycles using the Allocations instrument in a different way.
Close Instruments and return to Xcode. Choose Product ▸ Profile, and select the Allocations template.
This time, you won’t be using generation analysis. Instead, you’ll look at the number of objects of different types hanging around in memory. Click the Record button to start this run. You’ll see a huge number of objects filling up the detail panel — too many to look through! To help narrow down only the objects of interest, type Instrument as a filter in the field in the bottom-left corner. This filters out all other values, except those related to your app, “InstrumentsTutorial”.
The two columns worth noting in Instruments are # Persistent and # Transient. The # Persistent column keeps a count of how many objects of each type currently exist in memory. The # Transient column shows the number of objects that existed but have since been deallocated. Persistent objects are using up memory; transient objects are not.
Finding Persistent Objects
You’ll see a persistent instance of ViewController
. This makes sense because that’s the screen you’re currently looking at. There’s also an instance of the app’s AppDelegate
.
Back to the app! Perform a search and look at the results. A bunch of extra objects are now showing up in Instruments: SearchResultsViewController
and ImageCache
, among others. The ViewController
instance is still persistent, because it’s needed by its navigation controller.
Now tap the back button in the app. This pops SearchResultsViewController
off the navigation stack so that it’s deallocated. But it’s still showing a # Persistent count of 1 in the Allocations summary! Why is it still there?
Try performing another two searches and tap the back button after each one. There are now three SearchResultsViewControllers
?! Looks like you have a strong reference cycle!
Your main clue in this situation is that not only is SearchResultsViewController
persisting, but so are all the SearchResultsCollectionViewCells
. It’s likely the reference cycle is between these two classes.
Thankfully, the Visual Memory Debugger introduced in Xcode 8 is a neat tool that can help you further diagnose memory leaks and retain cycles. The Visual Memory Debugger is not part of Xcode’s Instruments suite but is such a useful tool that it’s worth including in this tutorial. Cross-referencing insights from both the Allocations instrument and the Visual Memory Debugger is a powerful technique that can make your debugging workflow more effective.
Getting Visual
Quit Instruments.
Before starting the Visual Memory Debugger, enable Malloc Stack logging in the Xcode scheme editor like this: Option-Click InstrumentsTutorial at the top of the window (next to the stop button). In the pop-up that appears, click Run and switch to Diagnostics. Check the box that says Malloc Stack and select Live Allocations Only, and then click Close.
Start the app from Xcode. As before, perform at least three searches to accumulate some data.
Now, activate the Visual Memory Debugger like this:
- Click Debug Memory Graph.
- Click the entry for
SearchResultsCollectionViewCell
. - You can click any object on the graph to view details in Inspector. There are multiple inspector panels, such as File, History, and Quick Help, where you can view more details.
- The most important one you want to see, though, is Memory Inspector.
The Visual Memory Debugger pauses your app and displays a visual, snapshot-in-time representation of objects in memory and the references between them.
As highlighted in the screenshot above, the Visual Memory Debugger displays the following information:
- Heap contents (Debug navigator pane): This shows you the list of all types and instances allocated in memory at the moment you paused your app. Clicking a type unfolds the row to show you the separate instances of the type in memory.
- Memory graph (main window): The main window shows a visual representation of objects in memory. The arrows between objects represent the references between them (strong and weak relationships).
- Memory inspector (Utilities pane): This includes details such as the class name and hierarchy, and whether a reference is strong or weak.
Some rows in the Debug navigator have a number in parentheses next to them. The number indicates how many instances of that specific type exist in memory. In the screenshot above, you’ll see that after a handful of searches, the Visual Memory Debugger confirms the results you saw in the Allocations instrument. In other words, anywhere from 20 to — if you scrolled to the end of the search results — 60 SearchResultsCollectionViewCell
instances for every SearchResultsViewController
instance are retained in memory.
Use the arrow on the left side of the row to unfold the type and show each SearchResultsViewController
instance in memory. Clicking an individual instance displays that instance and any references to it in the main window.
Notice the arrows pointing to SearchResultsViewController
. It looks like there are a few Swift closure contexts with references to the same view controller instance. Looks a little suspect, doesn’t it? Take a closer look. Select one of the arrows to display more information in the Utilities pane about the reference between one of these closure instances and SearchResultsViewController
.
In Memory Inspector, you can see the reference between Swift closure context and SearchResultsViewController
is strong. If you select the reference between SearchResultsCollectionViewCell
and Swift closure context, you’ll see this is marked strong as well. You can also see that the closure’s name: heartToggleHandler
. A-ha! SearchResultsCollectionViewCell
declares this!
Select the instance of SearchResultsCollectionViewCell
in the main window to show more information in Memory Inspector.
In the backtrace, you can see that the cell instance was initialized in collectionView(_:cellForItemAt:)
. When you hover over this row in the backtrace, a small arrow appears. Clicking the arrow takes you to this method in Xcode’s code editor.
In collectionView(_:cellForItemAt:)
, locate where each cell’s heartToggleHandler
property is set. You’ll see the following lines of code:
resultsCell.heartToggleHandler = { _ in
self.collectionView.reloadItems(at: [indexPath])
}
This closure handles when the user taps the heart button in a collection view cell. This is where the strong reference cycle lies, but it’s difficult to spot unless you’ve come across one before. Thanks to Visual Memory Debugger, you were able to follow the trail all the way to this piece of code!
The closure cell refers to the instance of SearchResultsViewController
using self
, which creates a strong reference. The closure captures self. Swift actually forces you to explicitly use the word self
in closures, whereas you can usually drop it when referring to methods and properties of the current object. This helps you be more aware of the fact you’re capturing it. SearchResultsViewController
also has a strong reference to the cells via its collection view.
Breaking That Cycle
To break a strong reference cycle, define a capture list as part of the closure’s definition. You’ll use a capture list to declare instances captured by closures as being either weak or unowned:
-
Weak: Use this when the captured reference might become
nil
in the future. If the object it refers to is deallocated, the reference becomesnil
. As such, it’s an optional type. -
Unowned: Use this when the closure and the object it refers to always have the same lifetime and are deallocated at the same time. An unowned reference can still become
nil
, and will be treated as explicitly unwrapped optional, if accessed beyond its lifetime. So use it wisely, when you know it’s not expected to becomenil
at the time it’s referenced.
To fix this strong reference cycle, add a capture list to heartToggleHandler
, like this:
resultsCell.heartToggleHandler = { [weak self] _ in
self?.collectionView.reloadItems(at: [indexPath])
}
Declaring self
as weak means SearchResultsViewController
can be deallocated even though the collection view cells hold a reference to it, as they’re now weak references. And deallocating SearchResultsViewController
will deallocate its collection view and, in turn, the cells.
From within Xcode, press Command-I again to build and run the app in Instruments.
Look at the app again in Instruments using Allocations. Remember to filter the results down to show only the classes that are part of the starter project. Perform a search, and navigate into the results and back again. You’ll see that SearchResultsViewController
and its cells are now deallocated when you navigate back. They show transient instances, but no persistent ones.
Cycle broken! Ship it!
Where to Go From Here?
You can download the finished project using the Download Materials button at the top or bottom of this tutorial.
Now that you have the knowledge from this Instruments tutorial under your belt, go and instrument your own code and see what interesting things appear! Also, try to make Instruments a part of your usual development workflow.
Run your code through Instruments often and perform a full sweep of your app before release to ensure you’ve caught as many memory management and performance issues as possible.
For more debugging fun, check out our video course on Intermediate iOS Debugging or read the Advanced Apple Debugging & Reverse Engineering book.
Now, go and make some awesome — and efficient — apps.
We hope you enjoyed this tutorial. If you have any questions or comments, please join the forum discussion below!