CareKit Tutorial for iOS: Part 2
In the second part of our CareKit tutorial, you’ll learn how to use Insights and Connect to build an iOS app that helps users manage and understand their personal health. By Jeff Rames.
Completion Bar Chart
Like its message item counterpart, OCKBarChart inherits from OCKInsightItem. For each bar it displays, it requires an OCKBarSeries to provide values and labels.
Open InsightsDataManager.swift and add the following computed property to InsightsDataManager:
var completionSeries: OCKBarSeries {
  // 1
  let completionValues = completionData.map({ NSNumber(value:$0.value) })

  // 2
  let completionValueLabels = completionValues
    .map({ NumberFormatter.localizedString(from: $0, number: .percent)})

  // 3
  return OCKBarSeries(
    title: "Zombie Training",
    values: completionValues,
    valueLabels: completionValueLabels,
    tintColor: UIColor.darkOrange())
}
This creates a series for completion data.
- You extract the
valueproperty fromcompletionDataand store it as an NSNumber incompletionValues. - You use
localizedString(from:number:)to create an array of strings in percent format to be used as labels on the chart. - You create and return the
OCKBarSeriesusing the above values and labels, also passing a title and tint color to be used on the chart.
With the series ready to go, create the bar chart. Add the following to InsightsDataManager:
func produceInsightsForAdherence() -> [OCKInsightItem] {
  // 1
  let dateStrings = completionData.map({(entry) -> String in
    guard let date = Calendar.current.date(from: entry.dateComponent)
      else { return "" }
    return DateFormatter.localizedString(from: date, dateStyle: .short, timeStyle: .none)
  })

  //TODO: Build assessment series

  // 2
  let chart = OCKBarChart(
    title: "Zombie Training Plan",
    text: "Training Compliance and Zombie Risks",
    tintColor: UIColor.green,
    axisTitles: dateStrings,
    axisSubtitles: nil,
    dataSeries: [completionSeries])

  return [chart]
}
- You map the
DateComponentsincompletionDatato formatted strings. You’ll use these as axis titles as you display a series of bars for each date. - You create the
OCKBarChartusing the abovedateStringsas axis titles and thecompletionSeriesof completion percentages as the sole data source. As you can see, it will be easy to later add additionalOCKBarSerieshere to compare multiple datasets.
Now that you have some Insights, you just have to get them up to the OCKInsightsViewController for display. Start by going to updateInsights(_:) and replacing:
print("completion data: \(self.completionData)")
completion(false, nil)
with:
let insightItems = self.produceInsightsForAdherence()
completion(true, insightItems)
This creates your Insight items and passes them up to the caller’s completion closure. Follow it to CarePlanStoreManager.swift and find where updateInsights() implements this closure. You don’t yet have a hook into the Insights controller, so you’ll need to create a way to get it there before adding anything here.
It wouldn’t be good practice for the store manager to maintain a reference to one of your controllers. Instead, you’ll create a protocol that can be used to delegate insight updates. Add the following definition just above CarePlanStoreManager:
protocol CarePlanStoreManagerDelegate: class {
  func carePlanStore(_: OCKCarePlanStore, didUpdateInsights insights: [OCKInsightItem])
}
The protocol defines a single method that will pass along an array of OCKInsightItem objects.
Add a property to the top of CarePlanStoreManager:
weak var delegate: CarePlanStoreManagerDelegate?
This allows you to assign a delegate that adopts your new protocol.
In updateInsights(), replace //TODO: pass insightItems to the insights controller with:
self.delegate?.carePlanStore(self.store, didUpdateInsights: insightItems)
This calls the delegate, passing the insightItems provided by the InsightsDataManager.
To make sure someone’s listening, go to TabBarViewController.swift and add the following extension to the file:
// MARK: - CarePlanStoreManagerDelegate
extension TabBarViewController: CarePlanStoreManagerDelegate {
  func carePlanStore(_ store: OCKCarePlanStore, didUpdateInsights insights: [OCKInsightItem]) {
    insightsViewController?.items = insights
  }
}
TabBarViewController now adopts the new protocol and implements carePlanStore(_:didUpdateInsights:). Setting items on an Insights controller causes it to automatically refresh with that data. Here, you’ve set it to the value passed over by the CarePlanStoreManager.
Go to init(coder:) and add the following just below the call to super.init(coder:):
carePlanStoreManager.delegate = self
carePlanStoreManager.updateInsights()
TabBarViewController is now the CarePlanStoreManagerDelegate, ready to be notified when new insights arrive. You also call updateInsights() directly here to ensure insights are ready at launch, even if no updates have occurred.
Build and run, then complete some items in Zombie Training. Unless it’s the first day of the week, use the date selector header to jump to earlier dates and complete some there too. Check the Insights tab, and you’ll see a bar chart representing the completion data you’ve generated this week!

That was a lot of work, but now that you have the architecture in place, adding additional insights just requires packaging up their data.

Assessment Bar Chart
Seeing the daily adherence percentage only tells part of the story. If you could view them alongside collected pulse and temperature assessments, you might be able to tell a full story. Possibly a horror story!
To obtain pulse and temperature values for each day, you need to fetch the associated activities. Open InsightsDataManager.swift and add the following method to InsightsDataManager:
func findActivityWith(_ activityIdentifier: ActivityIdentifier) -> OCKCarePlanActivity? {
  let semaphore = DispatchSemaphore(value: 0)
  var activity: OCKCarePlanActivity?

  DispatchQueue.main.async {
    self.store.activity(forIdentifier: activityIdentifier.rawValue) { success, foundActivity, error in
      activity = foundActivity
      semaphore.signal()
    }
  }

  let _ = semaphore.wait(timeout: DispatchTime.distantFuture)

  return activity
}
You use a semaphore and semaphore.wait in this method to effectively make it run synchronously. This is because you’ll eventually call it on a background thread that requires it to return an activity before moving on.
Beyond that, it simply calls activity(forIdentifier:completion:) which will query the store for an activity with the passed identifier.
Note: You call activity(forIdentifier:completion:) on the main queue due to a bug that results in a crash if run elsewhere. Apple references a radar that exists for this in their sample CareKit application.
Note: You call activity(forIdentifier:completion:) on the main queue due to a bug that results in a crash if run elsewhere. Apple references a radar that exists for this in their sample CareKit application.
Remember that the results of interventions and assessments don’t reside in the activity itself, but rather in the events associated with it. You need to write some code to read through the events for an activity and pull out results, so add the following method to the same class:
func fetchActivityResultsFor(_ activity: OCKCarePlanActivity,
                             startDate: DateComponents, endDate: DateComponents,
                             completionClosure: @escaping (_ fetchedData: [DateComponents: Double]) ->()) {
  var fetchedData = [DateComponents: Double]()
  // 1
  self.gatherDataGroup.enter()
  // 2
  store.enumerateEvents(
    of: activity,
    startDate: startDate,
    endDate: endDate,
    // 3
    handler: { (event, stop) in
      if let event = event,
        let result = event.result,
        let value = Double(result.valueString) {
        fetchedData[event.date] = value
      }
    },
    // 4
    completion: { (success, error) in
      guard success else { fatalError(error!.localizedDescription) }
      completionClosure(fetchedData)
      self.gatherDataGroup.leave()
  })
}
This method will pull result data for the passed activity. It takes a completionClosure to simplify getting the returned data back to the caller asynchronously. You’ll see this work shortly.
- As you did with the percentage complete, you’re using the
gatherDataGroupdispatch group to hold off the creation ofOCKInsightItemobjects until all data has been fetched. -
enumerateEvents(of:startDate:endDate:handler:completion:)is similar to the method used for completion data, except that it’s looking more generically at each event for a givenactivity. - For each event, you store the
resultinfetchedDatawith the event date as key. Note that in ZombieKit you only scheduled one assessment per type each day, and this implementation isn’t built to handle more. - You fail in the case of an error, then call the
completionClosurewith the data fetched for each day. Finally, you notifygatherDataGroupthat your work is done.
Next, add two properties to the top of this class:
var pulseData = [DateComponents: Double]()
var temperatureData = [DateComponents: Double]()
You’ll use these dictionaries to store your pulse and temperature data.
In updateInsights(_:), replace //TODO: fetch assessment data with:
guard let pulseActivity = self.findActivityWith(ActivityIdentifier.pulse) else { return }
self.fetchActivityResultsFor(pulseActivity, startDate: startDateComponents,
                             endDate: endDateComponents) { (fetchedData) in
  self.pulseData = fetchedData
}

guard let temperatureActivity = self.findActivityWith(ActivityIdentifier.temperature) else { return }
self.fetchActivityResultsFor(temperatureActivity, startDate: startDateComponents,
                             endDate: endDateComponents) { (fetchedData) in
  self.temperatureData = fetchedData
}
Here you grab both activities using findActivityWith(), then fetch the associated assessment data via fetchActivityResultsFor(_:startDate:endDate:completionClosure:). In the completion closures, you save the fetched data in pulseData and temperatureData.
Now you have the data to create an OCKBarSeries for each activity. Create the following method to do just that:
func barSeriesFor(data: [DateComponents: Double], title: String, tintColor: UIColor) -> OCKBarSeries {
  // 1
  let rawValues = completionData.map({ (entry) -> Double? in
    return data[entry.dateComponent]
  })

  // 2
  let values = DataHelpers().normalize(rawValues)

  // 3
  let valueLabels = rawValues.map({ (value) -> String in
    guard let value = value else { return "N/A" }
    return NumberFormatter.localizedString(from: NSNumber(value:value), number: .decimal)
  })

  // 4
  return OCKBarSeries(
    title: title,
    values: values,
    valueLabels: valueLabels,
    tintColor: tintColor)
}
Going through this:
- For each date in
completionData, which covers the range being mapped, you extract the corresponding value from the passeddataarray. -
normalizeis a method packaged with the starter project. This will normalize a dataset such that the highest value is 1.0 and lowest is 0.0. The values are also unwrapped and nils replaced with 0.0. With this, all of your bars plot on the same relative scale. - This creates the labels for your bar, replacing nil values with
"N/A"and displaying others in decimal format. - An
OCKBarSeriesis created using the passed title and tintColor as well as the values and labels you just derived.
Return to produceInsightsForAdherence(), where you earlier converted the percentage OCKBarSeries into a chart. Replace //TODO: Build assessment series with the following:
let pulseAssessmentSeries = barSeriesFor(data: pulseData, title: "Pulse",
                                         tintColor: UIColor.darkGreen())
let temperatureAssessmentSeries = barSeriesFor(data: temperatureData, title: "Temperature",
                                               tintColor: UIColor.darkYellow())
This creates two OCKBarSeries you can use in the chart for the pulse and temperature. Add these to the array passed in the dataSeries parameter in the OCKBarChart initialization, so it looks like this:
[completionSeries, temperatureAssessmentSeries, pulseAssessmentSeries]
Build and run, make sure you’ve filled out some assessments and intervention activities, and head to the Insights tab. You’ll see something like this:
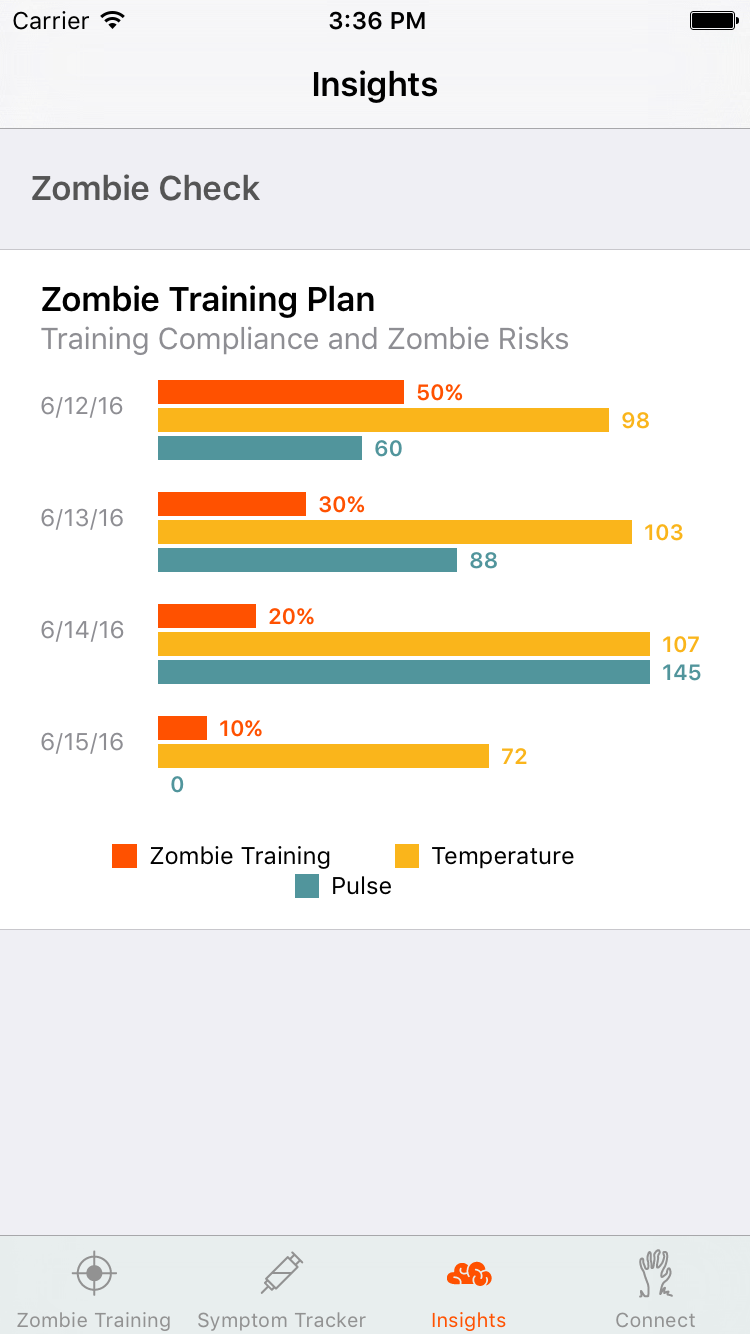
It took some effort, but now you have great visual insights that update automatically as events complete. It’s just too bad your survivor didn’t put as much effort into his or her training. Looking at the chart, I’d say the infection started late on the 13th. :]