Kubernetes Tutorial for Swift on the Server
In this tutorial, you’ll learn how to use Kubernetes to deploy a Kitura server that’s resilient, with crash recovery and replicas. You’ll start by using the kubectl CLI, then use Helm to combine it all into one command. By David Okun.
Building and Running Your RazeKube Docker Image
In Terminal, make sure that you’re in the root directory of your app. Enter the command kitura build, and go pour yourself a cup of coffee — this might take a few minutes. You should see output like this:
kitura build to continue.
Validating Docker image name
OK
Checking if Docker container razekube-swift-tools is running
OK
Deleting the container named 'razekube-swift-tools' ...
OK
Checking Docker image history to see if image already exists
OK
Creating image razekube-swift-tools based on Dockerfile-tools ...
Image will have user davidokunibm with id 501 added

Executing docker image build --file Dockerfile-tools --tag razekube-swift-tools --rm --pull
--build-arg bx_dev_userid=501 --build-arg bx_dev_user=davidokunibm .

OK
Creating a container named 'razekube-swift-tools' from that image...
OK
Starting the 'razekube-swift-tools' container...
OK
OK
Stopping the 'razekube-swift-tools' container...
OK
The Kitura CLI makes your life easier, while showing you the Docker commands it runs to build this image.
Next, enter the command kitura run — after about 30 seconds, you should see this output:
The run-cmd option was not specified
Stopping the 'razekube-swift-run' container...
OK
The 'razekube-swift-run' container is already stopped
Validating Docker image name
Binding IP and ports for Docker image.
OK
Checking if Docker container razekube-swift-run is running
OK
Deleting the container named 'razekube-swift-run' ...
OK
Checking Docker image history to see if image already exists
OK
Creating image razekube-swift-run based on Dockerfile ...

Executing docker image build --file Dockerfile --tag razekube-swift-run --rm --pull .
OK
Creating a container named 'razekube-swift-run' from that image...
OK
Starting the 'razekube-swift-run' container...
OK
Logs for the razekube-swift-run container:
[2019-07-10T21:06:23.250Z] [WARNING] [ConfigurationManager.swift:394 load(url:deserializerName:)] Unable to load data from URL /swift-project/config/mappings.json
[Wed Jul 10 21:06:23 2019] com.ibm.diagnostics.healthcenter.loader INFO: Swift Application Metrics
[2019-07-10T21:06:23.450Z] [INFO] [Metrics.swift:52 initializeMetrics(router:)] Initialized metrics.
[2019-07-10T21:06:23.456Z] [INFO] [HTTPServer.swift:237 listen(_:)] Listening on port 8080
These logs should look familiar — your API is now running in a Linux container via Docker!
Tagging Your RazeKube Docker Image
Open a web browser and navigate to localhost:8080 to make sure you can see the home page. Next, press Control-C in your Terminal to stop the container.
Now, enter the command docker image ls — your output should look like this:
REPOSITORY            TAG     IMAGE ID      CREATED         SIZE
razekube-swift-run    latest  eb85ef44e45f  2 minutes ago   598MB
razekube-swift-tools  latest  2008ae41e316  3 minutes ago   1.97GB
The Kitura CLI configures your app to use a separate container — razekube-swift-tools — to compile your app than the one that ultimately runs it — razekube-swift-run — all in the name of saving you space on your runtime.
Lastly, tag your image like so:
docker tag razekube-swift-run razekube-swift-run:1.0.0
Type docker image ls again to make sure your razekube-swift-run tag was created:
REPOSITORY            TAG     IMAGE ID       CREATED         SIZE
razekube-swift-run    1.0.0   eb85ef44e45f   3 minutes ago   598MB
razekube-swift-run    latest  eb85ef44e45f   3 minutes ago   598MB
razekube-swift-tools  latest  2008ae41e316   4 minutes ago   1.97GB
All right, next you’ll put this inside your Kubernetes cluster!
Deploying RazeKube to Kubernetes
First, type kubectl get all and kubectl get pods, and check that the output looks like so:
➜ kubectl get all
NAME                 TYPE        CLUSTER-IP   EXTERNAL-IP   PORT(S)   AGE
service/kubernetes   ClusterIP   10.96.0.1    <none>        443/TCP   19h
➜ kubectl get pods
No resources found.
In Kubernetes, a pod is the smallest unit available — just a set of co-located containers. Observing a pod is similar to observing an app you deploy.
Make a pod for RazeKube by entering the following command in Terminal:
kubectl create deployment razekube --image=razekube-swift-run:1.0.0
Confirm that your app deployed by running kubectl get pods, and check that your output looks similar to this:
NAME                        READY     STATUS    RESTARTS   AGE
razekube-6dfd6844f7-74j7f   1/1       Running   0          26s
Kubernetes creates a unique identifier for each pod as it runs, unless you specify otherwise. While this is great to see that your app is running, you haven’t yet configured a way to access it!
Creating a RazeKube Service
This is where Kubernetes begins to shine. Rather than take control away, you are given complete control over how your end users access each deployment via a service.
Add a point of access for your app by creating a service like so:
kubectl expose deployment razekube --type="NodePort" --port=8080
Now type kubectl get svc to get a list of exposed services currently in flight on Kubernetes, and you should see output like so:
NAME         TYPE        CLUSTER-IP      EXTERNAL-IP   PORT(S)          AGE
kubernetes   ClusterIP   10.96.0.1       <none>        443/TCP          20h
razekube     NodePort    10.105.98.111   <none>        8080:32612/TCP   1m
Notice the PORT(S) column — Kubernetes has mapped port 8080 on your app to a randomly assigned port. This port will be different every time, so make sure you note which port Kubernetes opened for you. Open a web browser, and navigate to that address, which would be localhost:32612 in my case. If you see the home page, ask the almighty Kube to demonstrate its power by navigating to localhost:32612/kubed?number=4 — you should see this:
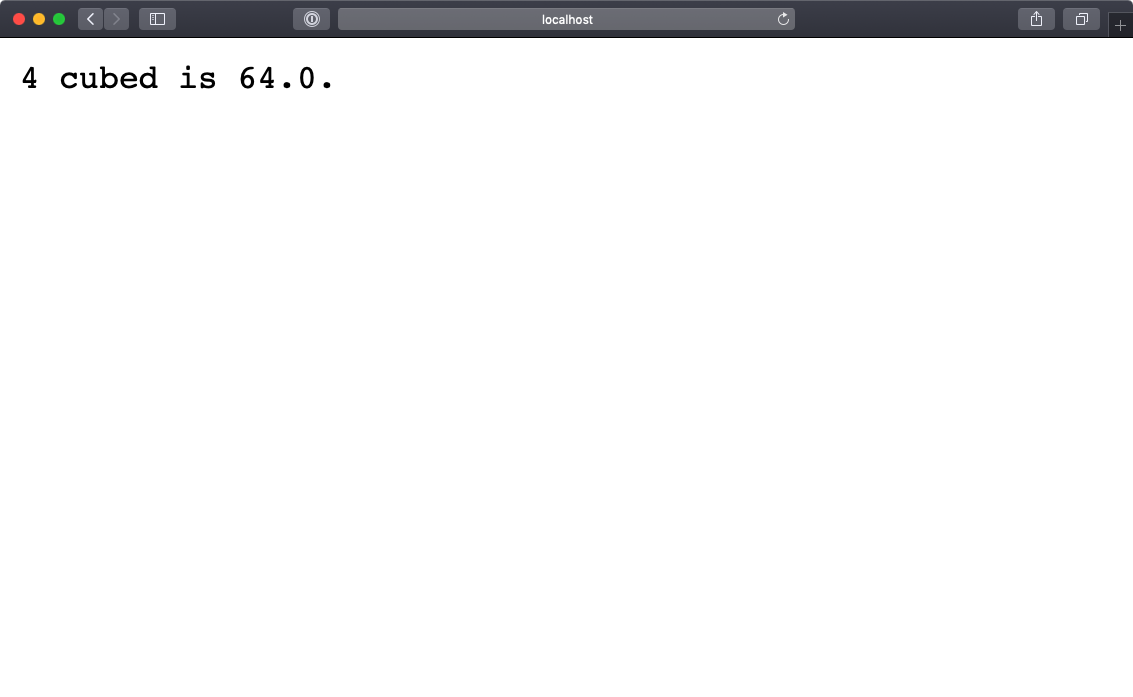
Nice! You are now running a Swift app on Kubernetes!!!
![]()
Recovering From a Crash
Now you’re going to test out how Kubernetes keeps things working for you. First, type kubectl get all in Terminal, and you should see the following output:
NAME                            READY     STATUS    RESTARTS   AGE
pod/razekube-6dfd6844f7-74j7f   1/1       Running   0          11m

NAME                 TYPE        CLUSTER-IP      EXTERNAL-IP   PORT(S)          AGE
service/kubernetes   ClusterIP   10.96.0.1       <none>        443/TCP          20h
service/razekube     NodePort    10.105.98.111   <none>        8080:32612/TCP   8m

NAME                       DESIRED   CURRENT   UP-TO-DATE   AVAILABLE   AGE
deployment.apps/razekube   1         1         1            1           11m

NAME                                  DESIRED   CURRENT   READY     AGE
replicaset.apps/razekube-6dfd6844f7   1         1         1         11m
Notice how every component of your state is enumerated for you.
Next, type the command kubectl get pods, but don’t press Return just yet. In a moment, what you’re going to do is:
- Navigate to
localhost:32612/uhohin your browser, which will deliberately crash your app. - Press Return in Terminal, and run the same
kubectl get podscommand over and over repeatedly until you see that yourSTATUSisRunning. Hint: Press the Up Arrow to redisplay the previous command. - Navigate to
localhost:32612in your browser.
As you keep entering your command in Terminal, you will see your pod state evolve like so:
NAME                        READY     STATUS    RESTARTS   AGE
razekube-6dfd6844f7-74j7f   0/1       Error     0          17m

NAME                        READY     STATUS             RESTARTS   AGE
razekube-6dfd6844f7-74j7f   0/1       CrashLoopBackOff   0          17m

NAME                        READY     STATUS                RESTARTS   AGE
razekube-6dfd6844f7-74j7f   0/1       ContainerCreating     1          17m

NAME                        READY     STATUS    RESTARTS   AGE
razekube-6dfd6844f7-74j7f   1/1       Running   1          17m
As Kubernetes scans the state of everything in your cluster, it reconciles how things are — crashed — with how it should be — etcd. If there is a mismatch, then Kubernetes works to resolve the difference!
You have dictated that there should be a functioning deployment called razekube, but by triggering the /uhoh route, that deployment is no longer functioning. When Kubernetes picks up that the non-functional state doesn’t match the desired functional state in etcd, it redeploys the container to bring it back to a functional state. After your deployment is running again, you then access your app to see that you’re back in business!