Getting Started with Mobile Analytics
Check out some real-world success stories of using mobile analytics, the best providers to use, and a simple three step approach to getting started. By Kishin Manglani.
Essentially, mobile analytics is a three-step process:
- Collecting data from your app.
- Analyzing the data to find out how users work with your app.
- Using that data to make business decisions about your app and its future development.
In this article, I’ll cover why you should add mobile analytics into to your app, and share some real-world, surprising insights I’ve gained from using analytics over the years.
Once you’re convinced of the benefits of mobile analytics, I’ll help you get started by sharing my three favorite mobile analytics platforms (and one honorable mention) and show you the pros and cons of each.
Let’s get analyzing!
Why Mobile Analytics?
Not using analytics in your app? You’re really putting yourself at a disadvantage.
Analytics can help you make data-driven decisions based on numbers — instead of making qualitative judgments based on speculation and best guesses. A scientific approach to planning your app’s future will helps you focus your limited development resources on the conversion strategies and features that resonate most with your users.
Specifically, analytics can help you discover which parts of your app people use, and more importantly, which parts they don’t. They can also tell you which features drive conversions, and can even tell you if people even use your app — something straight download stats can’t tell you.
Let me illustrate the usefulness of analytics with a few examples from my own work.
Analytics Example 1: Venmo
At Venmo, we used mobile analytics with the primary goal of growing our user base. We were hoping to improve signup conversion after users had downloaded the app. We tested two different landing pages:
- A feed view that displayed a social feed, but didn’t explain the app
- A static page that displayed an explanation of how the app worked
On the left, the feed view; on the right, the static page.

On the left, the feed view; on the right, the static page.
Which version is better? Without analytics, your guess is as good as mine.
However, by adding analytics into the app, we had definitive proof. The feed view on the left actually performed 20% better!
Not exact data, but illustrates the point!

Not exact data, but illustrates the point!
We found this a bit odd, considering the new page didn’t explain the app at all. That’s the magic of analytics, though: sometimes your insights can be counterintuitive.
Analytics Example 2: Steps
In my own app Steps, I developed a social feature that let users compete with friends:

I was inclined to further build out the social features, but once I looked at the data, I realized that most users weren’t engaging with the newly-built features:
Only 153 out of 12,517 (1.22%) of users logged in.

Only 153 out of 12,517 (1.22%) of users logged in.
I realized I was working on a feature that people weren’t really using. Instead of spending time and resources developing the social features, I figured it was more important to introduce the social feature to users first, and focus on developing the feature later.
In general, analytics can help you make the right decision, as opposed to what merely “feels right”.
Conclusions from Examples
I could bombard you with examples, but a super-simple answer to “Why mobile analytics?” is: “Why not?”
Adding mobile analytics to your app is incredibly easy to do. There are many platforms that make it easy to collect and analyze your data; I’ve recommended a few at the end of this article.
Generally, all that’s needed to implement analytics in your app is a few lines of code, like so:
Amplitude.instance().trackingSessionEvents = true
Amplitude.instance().initializeApiKey(API_KEY)
Amplitude.instance().logEvent(EVENT_NAME, withEventProperties: PROPERTIES)
It doesn’t take much time, and offers huge benefits. It’s hard to think of a reason why you wouldn’t use analytics.
If you want to get the benefits of analytics, remember to set time aside on your schedule to complete the second two steps: analyzing the data, and using that data, like the above examples demonstrated.
If you want to get the benefits of analytics, remember to set time aside on your schedule to complete the second two steps: analyzing the data, and using that data, like the above examples demonstrated.
Which Analytics to Collect?
There are two main types of data you should collect: basic usage data and custom events.
Basic Data
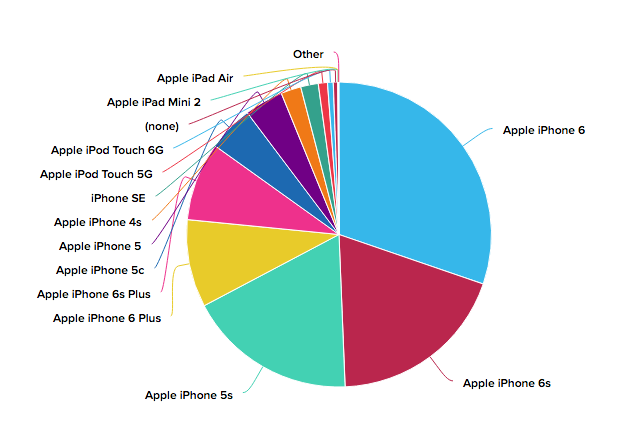
First off, there are some valuable, high-level pieces of data every app should collect, such as OS version, device information and language:
OS Version: If you can measure that 98% of your users are on iOS 9, and you want to adopt newer iOS features, or simply make your life easier and drop support for iOS 8, then you can feel confident in your decision. The opposite is also true: If most of your users are still on iOS 8, then it probably makes sense to continue to support for older iOS versions.
-
OS Version: If you can measure that 98% of your users are on iOS 9, and you want to adopt newer iOS features, or simply make your life easier and drop support for iOS 8, then you can feel confident in your decision. The opposite is also true: If most of your users are still on iOS 8, then it probably makes sense to continue to support for older iOS versions.

- Language: This tells you the language of the device as set in Settings. This, along with device location, can help you decide which languages you should target for localization.

- Device Information: This can help you determine what hardware features are available. If a lot of your users are on an iPhone 5 without a Co-Motion processor, it may be difficult to implement some Core Motion features.
Custom Events
Custom events are probably where you’ll spend your most time. By adding custom events, you can gain valuable insights particular to your app.
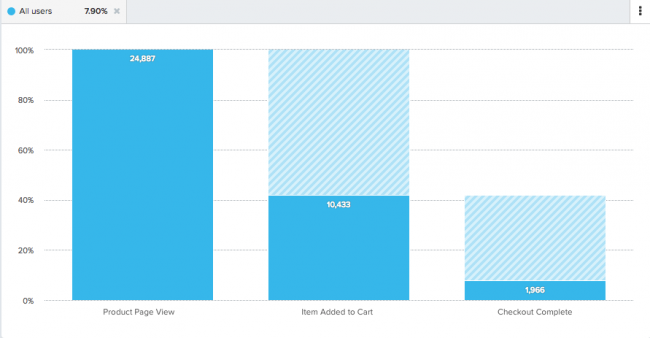
For example, a shopping app like Amazon may have an “Item Added to Cart” event and a “Checkout Completed” event triggered through code like the following:
Amplitude.instance().logEvent("Item Added to Cart")
You can also attach key-value attributes to these events through event properties. If a user has selected “Electronics” as his or her favorite shopping category, you might want to add a "favorite category": "electronics" property to the “Item Added To Cart” event with code similar to this:
Amplitude.instance().logEvent("Item Added To Cart", withEventProperties: ["favorite category": "electronics"])
You might think you should add a custom event for every feature and action in your app, then sift through the data to find actionable insights. After all, the more data the better, right?
But the issue is that too many data points and events can cloud the insights of your app, since you’re spreading your focus across too many disparate statistics.
Instead, focus on core actions of your app or funnels you would like to optimize.
A funnel is a series of events you can analyze to determine the percentage of users that go on to complete the series. For instance, you may want to determine how many users that reach the “Item Added to Cart” event eventually get to the “Checkout Completed” event. Though this is a simple two-step funnel, you can create funnels that contain many events.
One of the best starting points for custom events is to identify your optimization goals. Take the above example of the shopping cart. One way to improve this goal is to test the hypothesis that higher-rated products yield to a higher checkout rating. For this, you would create a funnel from “Item Added to Cart” to “Checkout Completed”.
You’d then add a “Number of Stars” event property to the “Item Added to Cart” event and filter the funnel by “Number of Stars”. This would let you analyze the difference in conversion rate between adding 3 star items vs. 5 star items to the cart.
Conversion rate of adding 3 star items vs 5 star items to the cart.

Conversion rate of adding 3 star items vs 5 star items to the cart.
You might find that items with 5 stars are three times more likely to checkout than products with other ratings — perhaps because users have confidence in the product. Knowing this, think about what you could change in your checkout process. For example, you may want to give more weight to higher product ratings when surfacing the product search results.