Intermediate Debugging with Xcode 8
Learn some intermediate debugging techniques with Xcode 8, such as breakpoint logging, conditional breakpoints, basic LLDB usage, and more. By George Andrews.
Sign up/Sign in
With a free Kodeco account you can download source code, track your progress, bookmark, personalise your learner profile and more!
Create accountAlready a member of Kodeco? Sign in
Sign up/Sign in
With a free Kodeco account you can download source code, track your progress, bookmark, personalise your learner profile and more!
Create accountAlready a member of Kodeco? Sign in
Contents
Update note: This tutorial has been updated to Xcode 9 and Swift 4 by George Andrews. The original tutorial was written by Brian Moakley.
The one constant in software development is bugs. Let’s face it, no one gets it right the first time. From fat fingers to incorrect assumptions, software development is like baking cakes in a roach motel – except that developers supply the critters!
Luckily, Xcode gives you a myriad of tools to keep the nasties at bay. There’s obviously the debugger you know and love, but there’s a lot more it can do for you than simply examine variables and step over code!
This is a tutorial for intermediate iOS developers, where you’ll get hands-on experience with some of the lesser-known but extremely useful debugging techniques, such as:
- Getting rid of NSLog in favor of breakpoint logging
- Using a build script to produce compiler warnings for comment TODOs and FIXMEs
- Breaking on conditions with expressions
- Dynamically modifying data with LLDB
- And much more!
My own goal is to become a truly lazy developer. I’d rather do the heavy work up front so I can relax on the backend. Thankfully, Xcode values my martini time. It provides great tools so I don’t have to be glued to my computer all day and all night.
Let’s take a look at these tools. Pull up a bean bag chair. Crack open your favorite beverage. It is time to get lazy! :]
Note that this tutorial assumes you already know the basics about the Xcode debugger. If you are completely new to debugging with Xcode, check out this beginner debugging tutorial first.
Getting Started
I put together a sample app for this project. You can download it here.
The app is called Gift Lister, and tracks gifts you might want to buy for people. It’s like Gifts 2 HD which was awarded Most Visually Impressive Reader’s App by this site way back in 2012. Gift Lister is like Gifts 2 HD… but far, far worse.
For one thing, it’s filled with bugs. The developer (myself in a different shirt) was ambitious and tried to fix the app the old fashioned way…and yes, it’s still broken :]
This tutorial will walk you through fixing the app while being as lazy as possible.
Okay, it’s time to get started — but don’t feel like you have to rush. :]
Open up the project and take a look around the various files. You’ll notice the app is a simple front end to a basic Core Data persistent store.
Note: If you don’t know Core Data, don’t worry! Core Data is an object persistence framework which is a whole tutorial to itself. In this tutorial, you will not dive into the framework, nor will you interact with Core Data objects in any meaningful way, so you don’t need to know much about it. Just keep in mind that Core Data loads objects and saves them so you don’t have to.
Note: If you don’t know Core Data, don’t worry! Core Data is an object persistence framework which is a whole tutorial to itself. In this tutorial, you will not dive into the framework, nor will you interact with Core Data objects in any meaningful way, so you don’t need to know much about it. Just keep in mind that Core Data loads objects and saves them so you don’t have to.
Now that you’ve taken a look around, you can set up the debugger.
Setting up the Debugger Console
The first thing to do whenever you start a debugging session is to open the debugging console. Open it by clicking this button on the main toolbar:

While the button is nice and convenient, clicking it for every debug session will provide unnecessary wear and tear on your fingertip. :] Wouldn’t you prefer that Xcode do it for you?
To do so, open the Xcode preferences by clicking ⌘, or by going to the application menu and selecting Xcode\Preferences. Click the Behaviors button (the button with the gear over it).
Click the Running\Starts item on the left hand side of the dialog. You will see a bunch of options appear on the right hand side. On the right hand side, click the seventh checkbox and then select Variables & Console View on the last dropdown.
Do this for the Pauses and the Generates Output items, which are located just underneath the Starts item.
The Variables & Console View option tells the debugger to show the list of local variables, as well as the console output each time a debugger session starts. If you wanted to view just the console output, you would select Console View. Likewise, if you wanted to see just the variables, you would select the Variable View.
The Current Views option defaults to the last debugger view on your last debugger session. For example, if you closed Variables and opted to just the view the console, then only the console would open the next time the debugger was started.
Close the dialog, then build and run.
The debugger will now open each time you build and run your app – without having to go through the major bother of clicking that button. Although it only takes a second to do that, it adds up to minutes per week. And after all, you’re trying to be lazy! :]
The NSLog Jam
Before continuing, it’s important to review the definition of a breakpoint.
A breakpoint is a point of time in a program that allows you to perform actions on the running program. Sometimes, the program may pause at the designated point to allow you to inspect the program’s state and/or step through the code.
You can also run code, change variables, and even have the computer quote Shakespeare. You will be doing all these things later in the tutorial.
Note: This tutorial will be covering some of the advanced uses of breakpoints. If you are still wrapping your head around some of its basic uses such as stepping-in, stepping-out, and stepping-over, please read over the My App Crashed, Now What? tutorial.
Note: This tutorial will be covering some of the advanced uses of breakpoints. If you are still wrapping your head around some of its basic uses such as stepping-in, stepping-out, and stepping-over, please read over the My App Crashed, Now What? tutorial.
Build and run the app. Then, try to add a new Friend to track gifts for. Not surprisingly, the app crashes when you try to add a new Friend. Let’s fix it up.
Can you feel the hours ticking away?
This project needs a little sanity. Currently, you can’t see the source of the compile error. To find it, you need to add an exception breakpoint to track down the source of the error.
Switch to the breakpoint navigator as shown below:

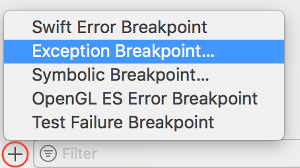
Then, click the plus sign at the bottom of the pane. From the menu, select Exception Breakpoint… .

You should now see this dialog:

The Exception field gives you the option of activating the breakpoint in Objective-C, C++, or All. Keep the default option of All.
The Break field in the dropdown allows you to pause execution depending on whether an error is thrown or caught. Keep it selected on thrown. If you’re actually making use of exception handling in your code, then select On Catch. For the purposes of this tutorial, leave it at On Throw.
You’ll cover the final two fields later in this tutorial. Click away to dismiss the dialog, then build and run.
This time the result is cleaner:
Take a look at the debugger console — it’s filled with log messages, and a lot of them appear unnecessary.
Logging is critical to debugging code. Log messages need to be actively pruned, or else the console will become littered with noise. Sifting through all that noise takes away from time on the golf course, so it’s important to remove it, otherwise you’ll waste more time on a problem than it deserves.
Open AppDelegate.swift and you should see a bunch of old messages in didFinishLaunchingWithOptions. Select them all and delete them.
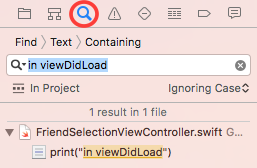
Time to find the next set of log statements. Open up the search navigator, and look for in viewDidLoad.

Click the search results and FriendSelectionViewController.swift will open to the line with the log statement.
Notice that this time the code uses print to create the log statement instead of NSLog. Generally, in Swift, you will use print to write to standard output, although you can use NSLog when needed.
It’s critical that the log message appears in the log; if you’re logging from multiple threads you don’t want to have to synchronize them yourself. Either approach can be used to display a message to the Console in a debug session.
At this point, the effort you’re putting into managing your log statements is starting to accumulate. It may not seem like a lot, but every minute adds up. By the end of a project cycle, those stray minutes can easily equate to hours.
Another disadvantage to hard-coding log statements is that each time you add one to the code base, you take a risk of injecting new bugs into your code. All it takes is a few keystrokes, a little autocomplete, then a small distraction – and your once-working app now has a bug.
It’s time to move those log statements out of the code to where they belong: breakpoints.
First, comment out both of the print statements. Next, add a breakpoint by left-clicking in the gutter beside each of the statements.
Your code window should look like this:

Control-click or right-click the first breakpoint and select Edit Breakpoint. From the dialog, click Add Action, then select Log Message from the Action dropdown. In the text field, type in viewDidLoad. The dialog should now look like the following:

Click away to dismiss the dialog, then build and run. You should now see in viewDidLoad in the console – but now it’s done with breakpoints instead of NSLog statements!
Note: Throughout this tutorial, you will be clicking build and run after each breakpoint modification, as this is easier to explain. The key point to remember: breakpoints are a runtime addition. You can add as many of them as you want during the execution of your program. This includes NSLog statements.
Note: Throughout this tutorial, you will be clicking build and run after each breakpoint modification, as this is easier to explain. The key point to remember: breakpoints are a runtime addition. You can add as many of them as you want during the execution of your program. This includes NSLog statements.
There is one major problem, though: the program stops at that breakpoint when you want it to continue, but changing that behavior is simple.
Control-click or right-click the breakpoint and select Edit Breakpoint. At the bottom of the dialog, click the Automatically continue after evaluating checkbox.
Now build and run again. This time it correctly logs the message…but it pauses on the second breakpoint.
Control-click or right-click the second breakpoint. Click Add Action, then select Log Message in the action dropdown, then type Loading friends…. At the bottom of the dialog, click the Automatically continue after evaluating checkbox.
Now build and run again. The app works great… until you try to add a Friend again and it crashes. You can’t have everything, it seems. :]
Believe it or not, you’re still doing too much work. Control-click or right-click the first breakpoint and replace in viewDidLoad with %B. Now run the app again. The console should look like this:

%B prints out the name of the containing method. You can also use %H to print out the number of times the method is being touched. Simple expressions can also be included.
So you could write: %B has been touched %H times. The console will read: viewDidLoad() has been touched 1 times.
Build and run, try to add a Friend, and then let the program crash. If you hit the exception breakpoint you set up earlier, click continue so you can see the crash description. The stack trace reads:
libc++abi.dylib: terminating with uncaught exception of type NSException
Something is not working in Core Data.
Scanning the code, you see that the entity is created from the persistentContainer's viewContext. You have a hunch that persistentContainer is probably the cause of the problem.
Take a look further up in the Console view and you will find the stack trace also reads:
CoreData: error:  Failed to load model named GiftList
Could not fetch. Error Domain=Foundation._GenericObjCError Code=0 "(null)", [:]
CoreData: error:  Failed to load model named GiftList
The error message is informing you that CoreData failed to load a data model named “GiftList”. If you look at the data model provided in the project, you will find it is actually named “GiftLister.”
Take another look at the code in AppDelegate.swift.
In my haste, I made a typo when providing the name argument for the Core Data stack’s persistentContainer. Instead of naming it “GiftLister”, I named it “GiftList.”
Change the name argument from “GiftList” to “GiftLister.”
let container = NSPersistentContainer(name: "GiftLister")
Build and run. Now try to add a Friend. Hooray — the app is (kind of) working!

Breakpoints and Expressions
So far so good, but you may have noticed that the breakpoint logging doesn’t show a timestamp of when the log message occurs, which can be useful for debugging purposes. The good news is that it’s easy to fix with breakpoint expressions!
Note: Date logging is indeed useful, but keep in mind it also makes the logging a bit slower as the system has to query all the date information. Keep that in mind if you ever find your logging calls lagging behind your application.
Note: Date logging is indeed useful, but keep in mind it also makes the logging a bit slower as the system has to query all the date information. Keep that in mind if you ever find your logging calls lagging behind your application.
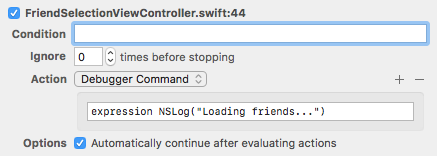
Let’s restore your log statements to their previous glory. Right-click or Control-click the second breakpoint in FriendSelectionViewController.swift. Click Edit Breakpoint. In the action, change from Log Message to Debugger Command and add the following to the text field:
expression NSLog("Loading friends...")
|
expression NSLog("Loading friends...")
It should look like this:

The Debugger command will now evaluate an expression in real time.
Build and run. You should now see the following:
2012-12-20 08:57:39.942 GiftLister[1984:11603] Loading friends...
Being able to add NSLog messages with a breakpoint means you no longer have to stop the program just to log important data, so there’s little chance you’ll introduce new bugs because you aren’t touching the code — but best of all, there’s no last-minute scrambles to remove all your debug statements the night before release.
Now to disable logging in the app. It’s simply a matter of clicking the breakpoints button in the debugger view.
![]()
Click that button and then build and run. Your logs are now nice and clean. You can also turn off individual log calls in the breakpoint navigator.
The days of filling your codebase with commented-out log statements are now over! :]


