Continuous Integration for Android
Learn how to use Continuous Integration for Android to be sure you have fully-verified and battle-tested code on the master branch. By Prashant Barahi.
Running Unit Tests
Now that you’ve added your code to the file system, use ./gradlew testDebugUnitTest to run the unit test with the Gradle wrapper.
./gradlew tasks to list all the Gradle tasks available.
Add below lines as a step of build-and-test job.
- name: Unit tests
  run: ./gradlew testDebugUnitTest
Add, commit and push the commits and you’ll see the workflow has executed the unit tests.

Running Instrumentation Tests
To execute the instrumentation tests, you need an Android device, preferably a virtual one. You’ll also need a custom runner. Luckily, there’s an Android emulator available. To benefit from the hardware acceleration, however, you have to use a macOS runner.
Amend the build-and-test job as shown below:
jobs:
  build-and-test:
    name: Build and run tests
    # runs-on: ubuntu-latest
    runs-on: macos-latest # Switched to macOS
    steps:
        ...
      - name: Run unit tests
        run: ./gradlew testDebugUnitTest

      - name: Run instrumentation tests
        uses: reactivecircus/android-emulator-runner@v2
        with:
          api-level: 29
          arch: x86
          profile: Nexus 6
          avd-name: test
          emulator-options: -no-window -gpu swiftshader_indirect -no-snapshot -noaudio -no-boot-anim -camera-back none
          disable-animations: true
          script: ./gradlew connectedCheck
Here, you’ve changed the runs-on key of build-and-test job to macos-latest and used reactivecircus/android-emulator-runner@v2 to spawn an Android emulator inside the macOS runner.
You can read more about usage and configurations of the emulator in its documentation.
Now, add, commit and push the changes. After the test cases get executed, you’ll find .html and .xml files inside app/build/reports. These contain the test results and summaries. They also come in handy when you need to analyze what went wrong during the test’s execution.
To upload these files as artifacts, right after the Run instrumentation tests step, add another step to define an action actions/upload-artifact@v1. It requires the path where the files to be uploaded are located and the name of the output artifact. Provide this using path and name key inside the with key as shown in snippet below:
- name: Upload Reports
  uses: actions/upload-artifact@v1
  with:
     name: reports
     path: app/build/reports
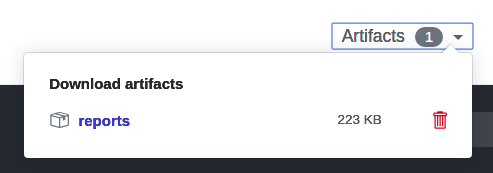
Again, add, commit and push your changes. After the job finishes, it generates an artifact with the name reports and associates it with the current workflow.
Generating the APK File
After the build succeeds, you’ll generate the APK file and upload it as an artifact.
While you could do this in the same build-and-test job, in this tutorial you’ll create another job and use the needs key to execute it after the build-and-test job completes.
Remember that each job gets a fresh instance of the runner. This means you have to check out the repository and set Java up, again!
Add this line right after the build-and-test job:
generate-apk:
  name: Generate apk
  runs-on: ubuntu-latest
  needs:
    - build-and-test
  steps:
    - uses: actions/checkout@v1

    - name: Setup JDK 1.8
      uses: actions/setup-java@v1
      with:
        java-version: 1.8

    - name: Generate apk
      run: ./gradlew assembleDebug

    - name: Upload APK
      uses: actions/upload-artifact@v1
      with:
        name: build-output
        path: app/build/outputs/apk/debug/app-debug.apk
The above snippet is similar to the build-and-test. It defines a job – generate-apk and uses needs key to declare its dependency on the former build-and-test job. Since no emulators are involved, this can be executed in ubuntu-latest runner. ./gradlew assembleDebug command generates an APK app-debug.apk at app/build/outputs/apk/debug/ directory. In the final step, provide this path to actions/upload-artifact@v1 action to upload it as an artifact.
Finally, add, commit and push. After the final step in the job completes, you’ll see that the APK you generated has been uploaded as an artifact named build-output.

Congrats! You’ve successfully implemented continuous integration for Android in your project. There’s just one more step to take until you can be confident that the code you merge to master is production-ready.
Code Coverage
Wait! As things stand, you could add 100 more features with no test cases to cover them and the build will still pass. That’s less than ideal — this loophole defeats the purpose of continuous integration.
To fix this, you need to add something that will fail the workflow if the test cases aren’t enough. This is where code coverage comes in.
A code coverage tool like JaCoCo, which stands for Java Code Coverage, uses the output of the tests to analyze the lines of codes touched by your test cases. If the coverage is below a specified threshold, it’ll fail your task, thus failing your workflow. Just what you need!
A function with one Bool argument can have two states: when the argument is true and when the argument is false. Similarly, a function with two Bool arguments will have 22 states. Now, imagine the number of states a function with an Int argument have. A lot!
But don’t worry, you don’t have to cover all those states. Covering just the boundary conditions is generally enough. However, this is something to keep in mind while writing tests.
Now, it’s time to see how JaCoCo works.
Setting up the JaCoCo Plugin
To set up the JaCoCo plugin in the Simple Calculator project, start by importing its Gradle plugin. In the project-level build.gradle file, add the JaCoCo Gradle plugin to the classpath:
buildscript {
  dependencies {
    // ...
    classpath "org.jacoco:org.jacoco.core:0.8.5"
  }
}
Next, apply and configure the plugin in the app-level build.gradle:
apply plugin: 'jacoco'

android {
   // ...

   buildTypes {
    debug {
        testCoverageEnabled true
      }
   }
}

jacoco {
  toolVersion = "0.8.5"
}

tasks.withType(Test) {
  jacoco.includeNoLocationClasses = true
}
This code tells Gradle that we will be using the JaCoCo plugin version 0.8.5.
Since this project contains Kotlin code, the generated classes will be inside app/build/tmp/kotlin-classes/debug.
Next, think back to the structure of app/build; this is similar. The unit tests generate an .exec file inside the jacoco directory, while instrumentation tests generate an .ec file in outputs/code_coverage/debugAndroidTest/connected. You need to explicitly tell the JaCoCo task to take them both into account when generating the coverage report.
Add following code to the end of app-level build.gradle file:
// Files with such regex patterns are to be excluded
def fileFilter = ['**/R.class', '**/R$*.class', '**/BuildConfig.*',
                  '**/Manifest*.*', '**/*Test*.*', 'android/**/*.*']

// Location of generated output classes
def debugTree = fileTree(dir: "$project.buildDir/tmp/kotlin-classes/debug",
   excludes: fileFilter)

// Source code directory
def mainSrc = "$project.projectDir/src/main/java"

// Task declaration
task jacocoTestReport(type: JacocoReport) {
  // Runs only after the dependencies are executed
  dependsOn = ['testDebugUnitTest', 'createDebugCoverageReport']
  // Export formats
  reports {
    xml.enabled = true
    html.enabled = true
  }

  sourceDirectories.setFrom(files([mainSrc]))
  classDirectories.setFrom(files([debugTree]))

  // Inform Gradle where the files generated by test cases - are located
  executionData.from = fileTree(dir: project.buildDir, includes: [
      'jacoco/testDebugUnitTest.exec',
      'outputs/code_coverage/debugAndroidTest/connected/*.ec'
  ])
}
Execute the task using ./gradlew jacocoTestReport. After completion, you’ll see that the reports are generated in app/build/reports/jacoco/jacocoTestReport/html. Navigate to the mentioned path and open the index.html using a web browser to analyze the coverage reports.

The lines with the green highlights are covered by the test, the yellow ones are partially covered and the red ones aren’t covered at all. You should add more tests to increase the test coverage.
Your next step is to add the ability to fail the build when not enough code goes through testing.