Assembly Register Calling Convention Tutorial

Learn how the CPU uses registers in this tutorial taken from our newest book, Advanced Apple Debugging & Reverse Engineering! By Derek Selander.

Leave a rating/review
Save for later
Share

In this tutorial, you’ll look at registers the CPU uses and explore and modify parameters passed into function calls. You’ll also learn about common Apple computer architectures and how their registers are used within a function. This is known as an architecture’s calling convention.

Knowing how assembly works and how a specific architecture’s calling convention works is an extremely important skill to have. It lets you observe function parameters you don’t have the source code for and lets you modify the parameters passed into a function. In addition, it’s sometimes even better to go to the assembly level because your source code could have different or unknown names for variables you’re not aware of.

For example, let’s say you always wanted to know the second parameter of a function call, regardless of what the parameter’s name is. Knowledge of assembly gives you a great base layer to manipulate and observe parameters in functions.

Assembly 101

Wait, so what’s assembly again?

Have you ever stopped in a function you didn’t have source code for, and saw an onslaught of memory addresses followed by scary, short commands? Did you huddle in a ball and quietly whisper to yourself you’ll never look at this dense stuff again? Well… that stuff is known as assembly!

Here’s a picture of a backtrace in Xcode, which showcases the assembly of a function within the Simulator.

Looking at the image above, the assembly can be broken into several parts. Each line in a assembly instruction contains an opcode, which can be thought of as an extremely simple instruction for the computer.

So what does an opcode look like? An opcode is an instruction that performs a simple task on the computer. For example, consider the following snippet of assembly:

pushq   %rbx
subq    $0x228, %rsp 
movq    %rdi, %rbx 

In this block of assembly, you see three opcodes, pushq, subq, and movq. Think of the opcode items as the action to perform. The things following the opcode are the source and destination labels. That is, these are the items the opcode acts upon.

In the above example, there are several registers, shown as rbx, rsp, rdi, and rbp. The % before each tells you this is a register.

In addition, you can also find a numeric constant in hexadecimal shown as 0x228. The $ before this constant tells you it’s an absolute number.

There’s no need to know what this code is doing at the moment, since you’ll first need to learn about the registers and calling convention of functions.

Note: In the above example, take note there are a bunch of %’s and $’s that precede the registers and constants. This is how the disassembler formats the assembly. However, there are two main ways that assembly can be showcased. The first is Intel assembly, and the second is AT&T assembly.

By default, Apple’s disassembler tools ship with assembly displayed in the AT&T format, as it is in the example above. Although this is a good format to work with, it can admittedly be a little hard on the head.

x86_64 vs ARM64

As a developer for Apple platforms, there are two primary architectures you’ll deal with when learning assembly: x86_64 architecture and ARM64 architecture. x86_64 is the architecture most likely used on your macOS computer, unless you are running an “ancient” Macintosh.

x86_64 is a 64-bit architecture, which means every address can hold up to 64 1s or 0s. Alternatively, older Macs use a 32-bit architecture, but Apple stopped making 32-bit Macs at the end of the 2010’s. Programs running under macOS are likely to be 64-bit compatible, including programs on the Simulator. That being said, even if your macOS is x86_64, it can still run 32-bit programs.

If you have any doubt of what hardware architecture you’re working with, you can get your computer’s hardware architecture by running the following command in Terminal:

uname -m 

ARM64 architecture is used on mobile devices such as your iPhone where limiting energy consumption is critical.

ARM emphasizes power conservation, so it has a reduced set of opcodes that help facilitate energy consumption over complex assembly instructions. This is good news for you, because there are fewer instructions for you to learn on the ARM architecture.

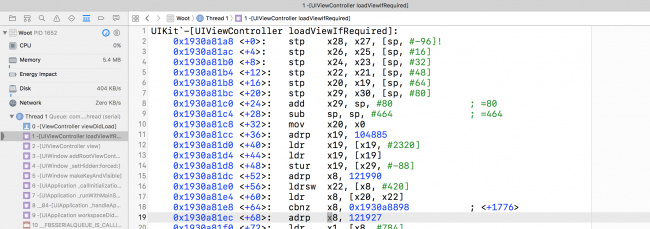
Here’s a screenshot of the same method shown earlier, except this time in ARM64 assembly on an iPhone 7:

in many of their devices, but have since moved to 64-bit ARM processors. 32-bit devices are almost obsolete as Apple has phased them out through various iOS versions. For example, the iPhone 4s is a 32-bit device which is not supported in iOS 10. All that remains in the 32-bit iPhone lineup is the iPhone 5, which iOS 10 does support.

Interestingly, all Apple Watch devices are currently 32-bit. This is likely because 32-bit ARM CPUs typically draw less power than their 64-bit cousins. This is really important for the watch as the battery is tiny.

Since it’s best to focus on what you’ll need for the future, Advanced Apple Debugging & Reverse Engineering will focus primarily on 64-bit assembly for both architectures. In addition, you’ll start learning x86_64 assembly first and then transition to learning ARM64 assembly so you don’t get confused. Well, not too confused.

x86_64 Register Calling Convention

Your CPU uses a set of registers in order to manipulate data in your running program. These are storage holders, just like the RAM in your computer. However they’re located on the CPU itself very close to the parts of the CPU that need them. So these parts of the CPU can access these registers incredibly quickly.

Most instructions involve one or more registers and perform operations such as writing the contents of a register to memory, reading the contents of memory to a register or performing arithmetic operations (add, subtract, etc.) on two registers.

In x64 (from here on out, x64 is an abbreviation for x86_64), there are 16 general purpose registers used by the machine to manipulate data.

These registers are RAX, RBX, RCX, RDX, RDI, RSI, RSP, RBP and R8 through R15. These names will not mean much to you now, but you’ll explore the importance of each register soon.

When you call a function in x64, the manner and use of the registers follows a very specific convention. This dictates where the parameters to the function should go and where the return value from the function will be when the function finishes. This is important so code compiled with one compiler can be used with code compiled with another compiler.

For example, take a look at this simple Objective-C code:

NSString *name = @"Zoltan";
NSLog(@"Hello world, I am %@. I'm %d, and I live in %@.", name, 30, @"my father's basement");

There are four parameters passed into the NSLog function call. Some of these values are passed as-is, while one parameter is stored in a local variable, then referenced as a parameter in the function. However, when viewing code through assembly, the computer doesn’t care about names for variables; it only cares about locations in memory.

The following registers are used as parameters when a function is called in x64 assembly. Try and commit these to memory, as you’ll use these frequently in the future:

  • First Argument: RDI
  • Second Argument: RSI
  • Third Argument: RDX
  • Fourth Argument: RCX
  • Fifth Argument: R8
  • Sixth Argument: R9

If there are more than six parameters, then the program’s stack is used to pass in additional parameters to the function.

Going back to that simple Objective-C code, you can re-imagine the registers being passed like the following pseudo-code:

RDI = @"Hello world, I am %@. I'm %d, and I live in %@.";
RSI = @"Zoltan";
RDX = 30;
RCX = @"my father's basement";
NSLog(RDI, RSI, RDX, RCX);

As soon as the NSLog function starts, the given registers will contain the appropriate values as shown above.

However, as soon as the function prologue (the beginning section of a function that prepares the stack and registers) finishes executing, the values in these registers will likely change. The generated assembly will likely overwrite the values stored in these registers, or just simply discard these references when the code has no more need of them.

This means as soon as you leave the start of a function (through stepping over, stepping in, or stepping out), you can no longer assume these registers will hold the expected values you want to observe, unless you actually look at the assembly code to see what it’s doing.

This calling convention heavily influences your debugging (and breakpoint) strategy. If you were to automate any type of breaking and exploring, you would have to stop at the start of a function call in order to inspect or modify the parameters without having to actually dive into the assembly.

Objective-C and Registers

Registers use a specific calling convention. You can take that same knowledge and apply it to other languages as well.

When Objective-C executes a method, a special C function is executed named objc_msgSend. There’s actually several different types of these functions, but more on that later. This is the heart of message dispatch. As the first parameter, objc_msgSend takes the reference of the object upon which the message is being sent. This is followed by a selector, which is simply just a char * specifying the name of the method being called on the object. Finally, objc_msgSend takes a variable amount of arguments within the function if the selector specifies there should be parameters.

Let’s look at a concrete example of this in an iOS context:

[UIApplication sharedApplication];

The compiler will take this code and create the following pseudocode:

id UIApplicationClass = [UIApplication class];
objc_msgSend(UIApplicationClass, "sharedApplication");

The first parameter is a reference to the UIApplication class, followed by the sharedApplication selector. An easy way to tell if there are any parameters is to simply check for colons in the Objective-C selector. Each colon will represent a parameter in a Selector.

Here’s another Objective-C example:

NSString *helloWorldString = [@"Can't Sleep; " stringByAppendingString:@"Clowns will eat me"];

The compiler will create the following (shown below in pseudocode):

NSString *helloWorldString; 
helloWorldString = objc_msgSend(@"Can't Sleep; ", "stringByAppendingString:", @"Clowns will eat me");

The first argument is an instance of an NSString (@"Can't Sleep; "), followed by the selector, followed by a parameter which is also an NSString instance.

Using this knowledge of objc_msgSend, you can use the registers in x64 to help explore content, which you’ll do very shortly.

Putting Theory to Practice

You can download the starter project for this tutorial here.

For this section, you’ll be using a project supplied in this tutorial’s resource bundle called Registers.

Open this project up through Xcode and give it a run.

This is a rather simple application which merely displays the contents of some x64 registers. It’s important to note that this application can’t display the values of registers at any given moment, it can only display the values of registers during a specific function call. This means that you won’t see too many changes to the values of these registers since they’ll likely have the same (or similar) value when the function to grab the register values is called.

Now that you’ve got an understanding of the functionality behind the Registers macOS application, create a symbolic breakpoint for NSViewController’s viewDidLoad method. Remember to use “NS” instead of “UI”, since you’re working on a Cocoa application.

Build and rerun the application. Once the debugger has stopped, type the following into the LLDB console:

(lldb) register read

This will list all of the main registers at the paused state of execution. However, this is too much information. You should selectively print out registers and treat them as Objective-C objects instead.

If you recall, -[NSViewController viewDidLoad] will be translated into the following assembly pseudocode:

RDI = UIViewControllerInstance 
RSI = "viewDidLoad"
objc_msgSend(RDI, RSI)

With the x64 calling convention in mind, and knowing how objc_msgSend works, you can find the specific NSViewController that is being loaded.

Type the following into the LLDB console:

(lldb) po $rdi 

You’ll get output similar to the following:

<Registers.ViewController: 0x6080000c13b0>

This will dump out the NSViewController reference held in the RDI register, which as you now know, is the location of the first argument to the method.

In LLDB, it’s important to prefix registers with the $ character, so LLDB knows you want the value of a register and not a variable related to your scope in the source code. Yes, that’s different than the assembly you see in the disassembly view! Annoying, eh?

Note: The observant among you might notice whenever you stop on an Objective-C method, you’ll never see the objc_msgSend in the LLDB backtrace. This is because the objc\_msgSend family of functions perfoms a jmp, or jump opcode command in assembly. This means that objc\_msgSend acts as a trampoline function, and once the Objective-C code starts executing, all stack trace history of objc\_msgSend will be gone. This is an optimization known as tail call optimization.

Try printing out the RSI register, which will hopefully contain the selector that was called. Type the following into the LLDB console:

(lldb) po $rsi 

Unfortunately, you’ll get garbage output that looks something like this:

140735181830794

Why is this?

An Objective-C selector is basically just a char *. This means, like all C types, LLDB does not know how to format this data. As a result, you must explicitly cast this reference to the data type you want.

Try casting it to the correct type:

(lldb) po (char *)$rsi 

You’ll now get the expected:

"viewDidLoad"

Of course, you can also cast it to the Selector type to produce the same result:

(lldb) po (SEL)$rsi

Now, it’s time to explore an Objective-C method with arguments. Since you’ve stopped on viewDidLoad, you can safely assume the NSView instance has loaded. A method of interest is the mouseUp: selector implemented by NSView’s parent class, NSResponder.

In LLDB, create a breakpoint on NSResponder’s mouseUp: selector and resume execution. If you can’t remember how to do that, here are the commands you need:

(lldb) b -[NSResponder mouseUp:]
(lldb) continue

Now, click on the application’s window. Make sure to click on the outside of the NSScrollView as it will gobble up your click and the -[NSResponder mouseUp:] breakpoint will not get hit.

As soon as you let go of the mouse or the trackpad, LLDB will stop on the mouseUp: breakpoint. Print out the reference of the NSResponder by typing the following into the LLDB console:

(lldb) po $rdi 

You’ll get something similar to the following:

<NSView: 0x608000120140>

However, there’s something interesting with the selector. There’s a colon in it, meaning there’s an argument to explore! Type the following into the LLDB console:

(lldb) po $rdx 

You’ll get the description of the NSEvent:

NSEvent: type=LMouseUp loc=(351.672,137.914) time=175929.4 flags=0 win=0x6100001e0400 winNum=8622 ctxt=0x0 evNum=10956 click=1 buttonNumber=0 pressure=0 deviceID:0x300000014400000 subtype=NSEventSubtypeTouch

How can you tell it’s an NSEvent? Well, you can either look online for documentation on -[NSResponder mouseUp:] or, you can simply use Objective-C to get the type:

(lldb) po [$rdx class]

Pretty cool, eh?

Sometimes it’s useful to use registers and breakpoints in order to get a reference to an object you know is alive in memory.

For example, what if you wanted to change the front NSWindow to red, but you had no reference to this view in your code, and you didn’t want to recompile with any code changes? You can simply create a breakpoint you can easily trip, get the reference from the register and manipulate the instance of the object as you please. You’ll try changing the main window to red now.

Note: Even though NSResponder implements mouseDown:, NSWindow overrides this method since it’s a subclass of NSResponder. You can dump all classes that implement mouseDown: and figure out which of those classes inherit from NSResponder to determine if the method is overridden without having access to the source code. An example of dumping all the Objective-C classes that implement mouseDown: is image lookup -rn '\ mouseDown:'

First remove any previous breakpoints using the LLDB console:

(lldb) breakpoint delete
About to delete all breakpoints, do you want to do that?: [Y/n] 

Then type the following into the LLDB console:

(lldb) breakpoint set -o -S "-[NSWindow mouseDown:]"
(lldb) continue

This sets a breakpoint which will fire only once — a one-shot breakpoint.

Tap on the application. Immediately after tapping, the breakpoint should trip. Then type the following into the LLDB console:

(lldb) po [$rdi setBackgroundColor:[NSColor redColor]]
(lldb) continue 

Upon resuming, the NSWindow will change to red!

Swift and Registers

When exploring registers in Swift, you’ll hit two hurdles that make assembly debugging harder than it is in Objective-C.

  1. First, registers are not available in the Swift debugging context. This means you have to get whatever data you want and then use the Objective-C debugging context to print out the registers passed into the Swift function. Remember that you can use the expression -l objc -O -- command, or alternatively use the cpo custom command found in Chapter 8 of the book, “Persisting and Customizing Commands”. Fortunately, the register read command is available in the Swift context.
  2. Second, Swift is not as dynamic as Objective-C. In fact, it’s sometimes best to assume that Swift is like C, except with a very, very cranky and bossy compiler. If you have a memory address, you need to explicitly cast it to the object you expect it to be; otherwise, the Swift debugging context has no clue how to interpret a memory address.

That being said, the same register calling convention is used in Swift. However, there’s one very important difference. When Swift calls a function, it has no need to use objc_msgSend, unless of course you mark up a method to use dynamic. This means when Swift calls a function, the previously used RSI register assigned to the selector will actually contain the function’s second parameter.

Enough theory — time to see this in action.

In the Registers project, navigate to ViewController.swift and add the following function to the class:

func executeLotsOfArguments(one: Int, two: Int, three: Int,
                            four: Int, five: Int, six: Int,
                            seven: Int, eight: Int, nine: Int,
                            ten: Int) {
    print("arguments are: \(one), \(two), \(three),
          \(four), \(five), \(six), \(seven),
          \(eight), \(nine), \(ten)")
}

Now, in viewDidLoad, call this function with the appropriate arguments:

override func viewDidLoad() {
  super.viewDidLoad()
  self.executeLotsOfArguments(one: 1, two: 2, three: 3, four: 4,
                              five: 5, six: 6, seven: 7,
                              eight: 8, nine: 9, ten: 10)
}

Put a breakpoint on the very same line as of the declaration of executeLotsOfArguments so the debugger will stop at the very beginning of the function. This is important, or else the registers might get clobbered if the function is actually executing.

Then remove the symbolic breakpoint you set on -[NSViewController viewDidLoad].

Build and run the app, then wait for the executeLotsOfArguments breakpoint to stop execution.

Again, a good way to start investigating is to dump the list registers. In LLDB, type the following:

(lldb) register read -f d 

This will dump the registers and display the format in decimal by using the -f d option. The output will look similar to this:

General Purpose Registers:
       rax = 7
       rbx = 9
       rcx = 4
       rdx = 3
       rdi = 1
       rsi = 2
       rbp = 140734799801424
       rsp = 140734799801264
        r8 = 5
        r9 = 6
       r10 = 10
       r11 = 8
       r12 = 107202385676032
       r13 = 106652628550688
       r14 = 10
       r15 = 4298620128  libswiftCore.dylib`swift_isaMask
       rip = 4294972615  Registers`Registers.ViewController.viewDidLoad () -> () + 167 at ViewController.swift:16
    rflags = 518
        cs = 43
        fs = 0
        gs = 0

As you can see, the registers follow the x64 calling convention. RDI, RSI, RDX, RCX, R8 and R9 hold your first six parameters.

You may also notice other parameters are stored in some of the other registers. While this is true, it’s simply a leftover from the code that sets up the stack for the remaining parameters. Remember, parameters after the sixth one go on the stack.

RAX, the Return Register

But wait — there’s more! So far, you’ve learned how six registers are called in a function, but what about return values?

Fortunately, there is only one designated register for return values from functions: RAX. Go back to executeLotsOfArguments and modify the function to return a String, like so:

func executeLotsOfArguments(one: Int, two: Int, three: Int,
                            four: Int, five: Int, six: Int,
                            seven: Int, eight: Int, nine: Int,
                            ten: Int) -> String {
    print("arguments are: \(one), \(two), \(three), \(four),
          \(five), \(six), \(seven), \(eight), \(nine), \(ten)")
    return "Mom, what happened to the cat?"
}

In viewDidLoad, modify the function call to receive and ignore the String value.

override func viewDidLoad() {
    super.viewDidLoad()
    let _ = self.executeLotsOfArguments(one: 1, two: 2,
          three: 3, four: 4, five: 5, six: 6, seven: 7,
          eight: 8, nine: 9, ten: 10)
}

Create a breakpoint somewhere in executeLotsOfArguments. Build and run again, and wait for execution to stop in the function. Next, type the following into the LLDB console:

(lldb) finish

This will finish executing the current function and pause the debugger again. At this point, the return value from the function should be in RAX. Type the following into LLDB:

(lldb) register read rax 

You’ll get something similar to the following:

rax = 0x0000000100003760  "Mom, what happened to the cat?"

Boom! Your return value!

Knowledge of the return value in RAX is extremely important as it will form the foundation of debugging scripts you’ll write in later sections.

Changing Values in Registers

In order to solidify your understanding of registers, you’ll modify registers in an already-compiled application.

Close Xcode and the Registers project. Open a Terminal window and launch the iPhone 7 Simulator. Do this by typing the following:

xcrun simctl list

You’ll see a long list of devices. Search for the latest iOS version for which you have a simulator installed. Underneath that section, find the iPhone 7 device. It will look something like this:

iPhone 7 (269B10E1-15BE-40B4-AD24-B6EED125BC28) (Shutdown)

The UUID is what you’re after. Use that to open the iOS Simulator by typing the following, replacing your UUID as appropriate:

open /Applications/Xcode.app/Contents/Developer/Applications/Simulator.app --args -CurrentDeviceUDID 269B10E1-15BE-40B4-AD24-B6EED125BC28

Make sure the simulator is launched and is sitting on the home screen. You can get to the home screen by pressing Command + Shift + H. Once your simulator is set up, head over to the Terminal window and attach LLDB to the SpringBoard application:

lldb -n SpringBoard

This attaches LLDB to the SpringBoard instance running on the iOS Simulator! SpringBoard is the program that controls the home screen on iOS.

Once attached, type the following into LLDB:

(lldb) p/x @"Yay! Debugging"

You should get some output similar to the following:

(__NSCFString *) $3 = 0x0000618000644080 @"Yay! Debugging!"

Take a note of the memory reference of this newly created NSString instance as you’ll use it soon. Now, create a breakpoint on UILabel’s setText: method in LLDB:

(lldb) b -[UILabel setText:]

Next, type the following in LLDB:

(lldb) breakpoint command add 

LLDB will spew some output and go into multi-line edit mode. This command lets you add extra commands to execute when the breakpoint you just added is hit. Type the following, replacing the memory address with the address of your NSString from above:

> po $rdx = 0x0000618000644080
> continue
> DONE

Take a step back and review what you’ve just done. You’ve created a breakpoint on UILabel’s setText: method. Whenever this method gets hit, you’re replacing what’s in RDX — the third parameter — with a different NSString instance that says Yay! Debugging!.

Resume the debugger by using the continue command:

(lldb) continue

Try exploring the SpringBoard Simulator app and see what content has changed. Swipe up from the bottom to bring up the Control Center, and observe the changes:

Try exploring other areas where modal presentations can occur, as this will likely result in a new UIViewController (and all of its subviews) being lazily loaded, causing the breakpoint action to be hit.

Although this might seem like a cool gimmicky programming trick, it provides an insightful look into how a limited knowledge of registers and assembly can produce big changes in applications you don’t have the source for.

This is also useful from a debugging standpoint, as you can quickly visually verify where the -[UILabel setText:] is executed within the SpringBoard application and run breakpoint conditions to find the exact line of code that sets a particular UILabel’s text.

To continue this thought, any UILabel instances whose text did not change also tells you something. For example, the UIButtons whose text didn’t change to Yay! Debugging! speaks for itself. Perhaps the UILabel’s setText: was called at an earlier time? Or maybe the developers of the SpringBoard application chose to use setAttributedText: instead? Or maybe they’re using a private method that is not publicly available to third-party developers?

As you can see, using and manipulating registers can give you a lot of insight into how an application functions. :]

Where to Go From Here?

Whew! That was a long one, wasn’t it? Sit back and take a break with your favorite form of liquid; you’ve earned it.

You can download the completed project from this tutorial here.

So what did you learn?

  • Architectures define a calling convention which dictates where parameters to a function and its return value are stored.
  • In Objective-C, the RDI register is the reference of the calling NSObject, RSI is the Selector, RDX is the first parameter and so on.
  • In Swift, RDI is the first argument, RSI is the second parameter, and so on provided that the Swift method isn’t using dynamic dispatch.
  • The RAX register is used for return values in functions regardless of whether you’re working with Objective-C or Swift.
  • Make sure you use the Objective-C context when printing registers with $.

There’s a lot you can do with registers. Try exploring apps you don’t have the source code for; it’s a lot of fun and will build a good foundation for tackling tough debugging problems.

Try attaching to an application on the iOS Simulator and map out the UIViewControllers as they appear using assembly, a smart breakpoint, and a breakpoint command.

If you enjoyed what you learned in the tutorial, why not check out the complete Advanced Apple Debugging & Reverse Engineering book, available on our store?

Here’s a taste of what’s in the book:

  • Getting Started: Learn your way around LLDB and its extensive list of subcommands and options.
  • Python Power: Use LLDB’s Python module to create powerful, custom debugging commands to introspect and augment existing programs.
  • Understanding Assembly: Truly understand how code works at an assembler-level and how you can explore code in memory.
  • Ptrace and Friends: Learn how to leverage ptrace, dlopen and dlsym to hook into C and Swift functions to explore code that you don’t have the source for.
  • Script Bridging: Extend the debugger to make it do almost anything you want, and learn how to pass in options or arguments to your debugging scripts.
  • DTrace: Dig deep and hook into a function with a DTrace probe to query a massive amount of process information.
  • …and more!

By the end of this book, you’ll have the tools and knowledge to answer even the most obscure question about your code — or someone else’s.

To celebrate the launch of the book, it’s currently on sale for $44.99 — that’s a $10 discount off the cover price! But don’t wait too long, as the launch deal is only on until Friday, May 19th.

If you have any questions or comments on this tutorial, feel free to join the discussion below!