Curved Line Charts in Flutter
Learn how to build Curved Line Charts in your Flutter app using the Canvas API. By Sam Smith.
Creating a Gradient Fill
To add a gradient fill to your chart, you need to add another section in the paint() method inside PathPainter. Right after you draw your line path with canvas.drawPath(path, paint), add the following code:
// paint the gradient fill
paint.style = PaintingStyle.fill;
paint.shader = ui.Gradient.linear(
 Offset.zero,
 Offset(0.0, size.height),
 [
   Colors.white.withOpacity(0.2),
   Colors.white.withOpacity(1),
 ],
);
canvas.drawPath(path, paint);
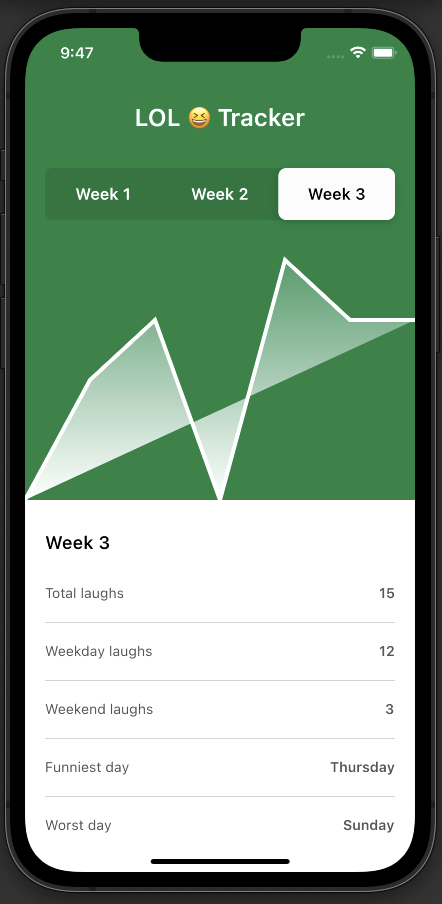
Build and run the app, and you'll see that you've added a fill to your path. But it's not exactly what you want.
You want that gradient connected to the bottom of the chart, so you'll need to add two more segments to the drawPath() function to close the path. Right after the for loop inside drawPath(), add these two lines:
path.lineTo(width, height);
path.lineTo(0, height);
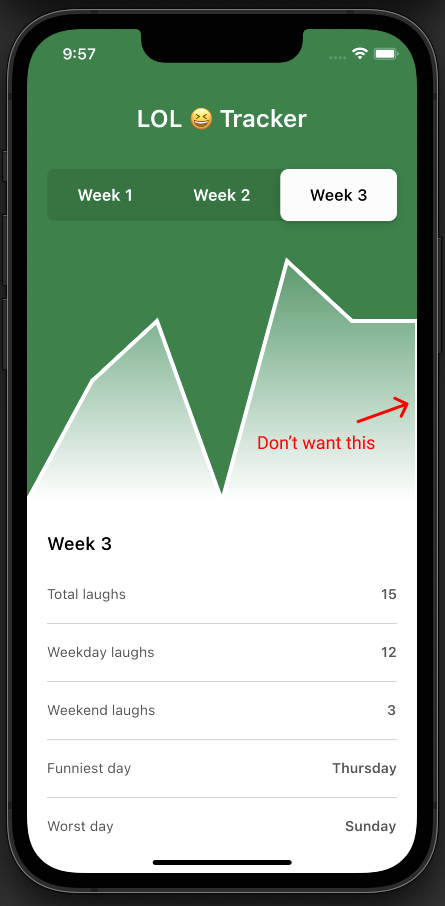
This closes the path, but if you look closely, you can see that the solid white line is now also following the closed path. This creates some unwanted visual artifacts.
This is not good, so you’ll need to set up two different paths – one for the solid line, and one for the gradient fill. To do this, add a closePath argument to your drawPath() function. Mind you, this will break your app, but don't worry, you'll fix it soon enoguth. Update drawPath to the following:
Path drawPath(bool closePath) {
Then wrap the two lines that close the path in an if-statement. The resulting drawPath will look like this:
Path drawPath(bool closePath) {
  final width = MediaQuery.of(context).size.width;
  final height = chartHeight;
  final segmentWidth = width / (chartData.length - 1);
  final path = Path();
  path.moveTo(0, height - chartData[0].value * height);
  for (var i = 1; i < chartData.length; i++) {
    final x = i * segmentWidth;
    final y = height - (chartData[i].value * height);
    path.lineTo(x, y);
  }

  if (closePath) {
    path.lineTo(width, height);
    path.lineTo(0, height);
  }

  return path;
}
Since you’re going to be passing two different paths into your painter now, add a second fillPath parameter to your PathPainter class, like this:
class PathPainter extends CustomPainter {
 Path path;
 Path fillPath;
 PathPainter({required this.path, required this.fillPath});
And when you draw your gradient, use fillPath instead of path. You can find this, right before the closing brace of the method:
  canvas.drawPath(fillPath, paint);
}
Lastly, update your CustomPaint() widget to pass two paths into the PathPainter, one that does close and one that doesn't:
CustomPaint(
  size: Size(MediaQuery.of(context).size.width, chartHeight),
  painter: PathPainter(
    path: drawPath(false),
    fillPath: drawPath(true),
  ),
),
Hot Reload the app! You're now passing two almost identical paths into your CustomPainter; the one for the fill that closes and the other for the line that doesn't close. Your chart looks pretty good, but those sharp jagged edges look dangerous. Time to learn how to smooth your line out and make it curvy.
Making Curved Lines
Creating curved lines in Flutter may seem daunting at first, but you’ll soon find it to be rather intuitive. The Path class includes many methods for drawing curved lines. In fact, you can use any of the following methods to create curves:
- addArc
- arcTo
- arcToPoint
- conicTo
- cubicTo
- quadraticBezierTo
- relativeArcToPoint
- relativeConicTo
- relativeCubicTo
- relativeQuadraticBezierTo
You will focus only on the cubicTo method, as it seems to work quite nicely when trying to draw a curve through several data points. The cubicTo method takes six arguments, or rather three different pairs of (x, y) coordinates. The (x3, y3) point is the ultimate destination of your line segment. The (x1, y1) and (x2, y2) coordinates create control points that act as handles that bend your line.
Don't worry if you don't 100% understand how cubicTo() is working yet. There is a diagram coming up that should help clear things up. Modify the drawPath() function as below:
Path drawPath(bool closePath) {
  final width = MediaQuery.of(context).size.width;
  final height = chartHeight;
  final path = Path();
  final segmentWidth = width / 3 / 2;
  path.moveTo(0, height);
  path.cubicTo(segmentWidth, height, 2 * segmentWidth, 0, 3 * segmentWidth, 0);
  path.cubicTo(4 * segmentWidth, 0, 5 * ssegmentWidth, height, 6 * segmentWidth, height);

  return path;
}
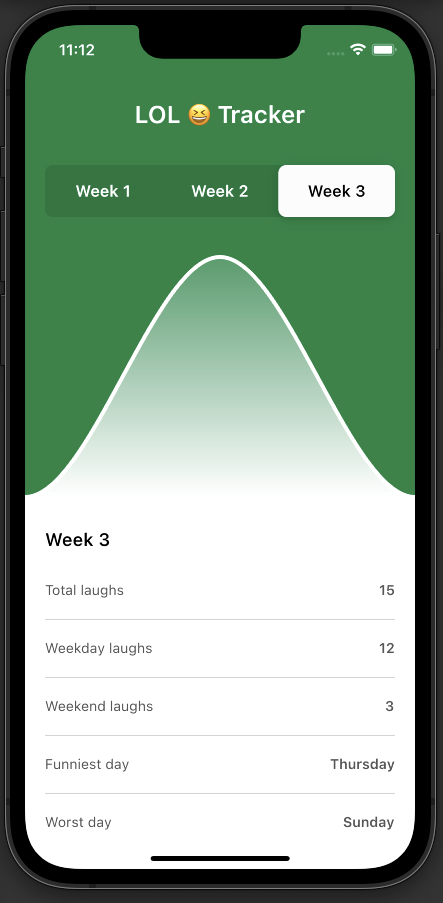
Build and run this code; you should see a nice big curved line.
You can see the first thing this code does is define segmentWidth, which is the width of a line segment . There are only two cubicTo() segments, but remember that each cubicTo() has three different coordinate pairs. So, by setting segmentWidth to be equal to the width of the page divided by six, you can have three evenly spaced coordinates within each of your two cubicTo() segments.
This diagram will help you visualize the six segments used in these two cubicTo() methods:
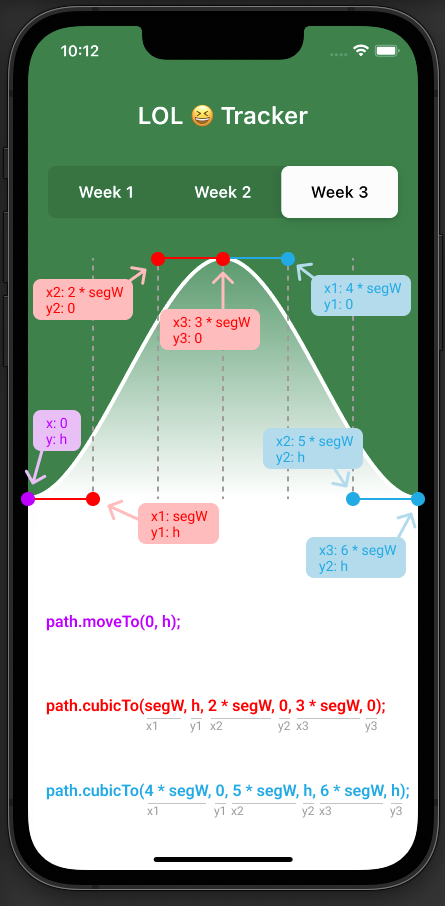
The points overlaid on this diagram are color-coded to a moveTo() or cubicTo() method. You’ll see that the third redpoint from the left of the screen is the target destination of the first cubicTo() method. The first and second red points are control points that bend the line into a curve.
Spend some time studying this diagram until you feel comfortable with how the cubicTo() method works. Proceed to the next section, where you'll use this method with your laughing data when you're ready.
Combining Curved Lines with Data
You’ll need to update your drawPath() function again to loop through the laughing data and draw some curves using cubicTo(). Before doing that, now is a good time to add some padding constants.
Adding Padding
You'll need padding on the left and right sides of your charts to leave space for labels.
Near the top of your _DashboardState widget, right after you define chartHeight, add these constants:
static const leftPadding = 60.0;
static const rightPadding = 60.0;
Now that you have these padding constants, use them to define the segment width for your chart. Remember, there are three segments per cubicTo() method, so 18 total. This means your segment width is the screen width minus the padding, divided by 18. Update the segmentWidth in your drawPath() function:
final segmentWidth =
   (width - leftPadding - rightPadding) / ((chartData.length - 1) * 3);
Creating a cubicTo() Segment
Now replace the path segments you drew earlier with the following code. This will loop through your data points and create a cubicTo() segment for each data point:
path.moveTo(0, height - chartData[0].value * height);
path.lineTo(leftPadding, height - chartData[0].value * height);
// curved line
for (var i = 1; i < chartData.length; i++) {
 path.cubicTo(
     (3 * (i - 1) + 1) * segmentWidth + leftPadding,
     height - chartData[i - 1].value * height,
     (3 * (i - 1) + 2) * segmentWidth + leftPadding,
     height - chartData[i].value * height,
     (3 * (i - 1) + 3) * segmentWidth + leftPadding,
     height - chartData[i].value * height);
}
path.lineTo(width, height - chartData[chartData.length - 1].value * height);
// for the gradient fill, we want to close the path
if (closePath) {
 path.lineTo(width, height);
 path.lineTo(0, height);
}
That is a lot of code, but this cubicTo() method follows the same principles that you learned in the diagram a bit earlier. You can see that inside your for loop, the y1 value of your cubicTo() is always the y value of the previous chart data point. This will ensure that there is a smooth transition between each cubicTo() method.
Again, look at the diagram from earlier if you need to visualize how these control points are working.
Build and run the app. Now you can toggle between each of the weeks to see three different curved lines:

The last thing left to do is add labels to your chart, and then you'll have a proper custom line chart!