Sponsored Tutorial: Improving Your App’s Performance with Pulse.io
Learn how you can use Pulse.io to notify you of low frame rates, app stalls and more. Let us walk you through all the features in this Pulse.io tutorial. By Adam Eberbach.
Fixing the Frame Rate
iOS tries to render a frame once every sixtieth of a second, and your apps should aim for that same performance benchmark. If the code execution to prepare a frame exceeds ~1/60 second (less the actual time to display the frame), then you'll end up with a reduced frame rate.
If you're only slowed down by one or two frames per second most users won't even notice. However, when your frame rate drops to 20 frames/second you can bet most users will find it highly annoying. Using Pulse.io to track your frame rate keeps you ahead of your users and lets you detect slow frame rates before they are noticed by too many users.
One of the changes you made to the app was adding the label Providing Annotation View to a user action. The dashboard showed that slow frame rates were taking place in this specific user action. Pulse.io tells you exactly what your users are experiencing so you don't have to guess whether or not smooth scrolling on older devices is something you need to handle in your app design.
Map views like the one in this app require multiple annotation views to work together to provide smooth scrolling performance. Map Kit includes a reuse API since reusing an annotation is much faster than allocating a new one every time. Your app isn't reusing annotation views at the moment, which might explain at least some of the performance issues.
Open MapSightsViewController.m and find mapView:viewForAnnotation:. Find the following two lines that allocate new annotations:
sightAnnotationView = [[MKPinAnnotationView alloc] initWithAnnotation:annotation reuseIdentifier:kSightAnnotationIdentifier];
sightAnnotationView.canShowCallout = YES;
Replace the above lines with the following implementation:
sightAnnotationView = [mapview dequeueReusableAnnotationViewWithIdentifier:kSightAnnotationIdentifier];
if (sightAnnotationView == nil) {
  sightAnnotationView = [[MKPinAnnotationView alloc] initWithAnnotation:annotation reuseIdentifier:kSightAnnotationIdentifier];
  sightAnnotationView.canShowCallout = YES;
}
This mechanism is similar to the way table views or collection view cells get reused and should be somewhat familiar. The new implementation attempts to dequeue an existing annotation and only creates a new annotation if it fails to get one from the map view.
While this change has the least dramatic effect of all the changes made so far, you should always reuse objects whenever UIKit offers you the chance.
Now that you've completed all of the items on your fix list, you need to generate some more analytics in Pulse.io to see how your app performance has improved.
Build and run the app; pick several simulated locations and scroll around the map as an average user would. The question is — will the Pulse.io results show some improvement? Or has all your hard work been for naught?
Verifying Your Improvements
Here's a look at some sample data collected after making the code improvements and playing with the app for a bit:

The dashboard shows that the results above arrived a few hours after the first batch of results. Step One in any performance improvement process is to be sure you're looking at the right data! :]
At first glance things look like they might have improved, but you can't really tell until you dig down into the nitty gritty details.
Verifying Network and Memory
Take a close look at the number of network requests made now that you've reduced the excessive image loading:

That's a step in the right direction — you used the app for roughly the same amount of time and in approximately the same way that you did before, but the app made less than half of the network requests than before.
Drill down into Aggregate URL Response Times again and examine the queries made to flickr.com/* - are those URLs still exposing too much information?
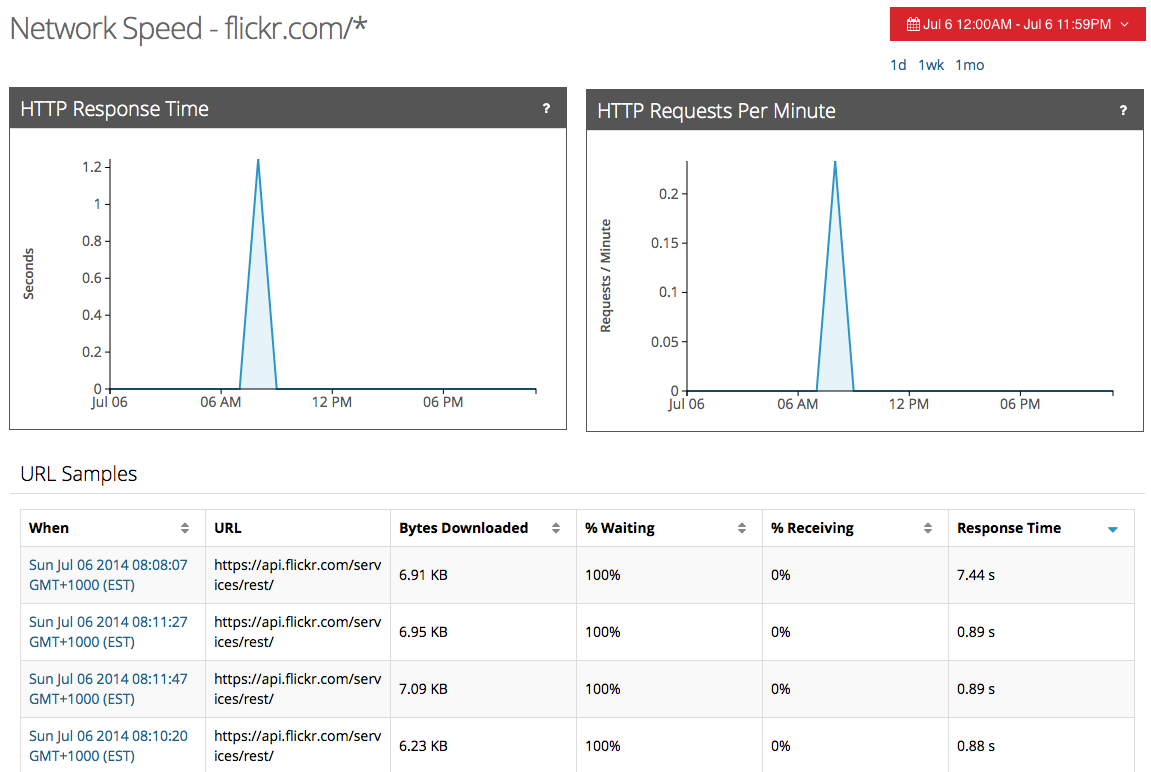
All URLs logged now have the query part of the request stripped thanks to setURLStrippingEnabled:. You could easily share these results without exposing any details of your web API or compromising other secrets. And even if you didn't have any secrets to hide, at least URLs in this format are a heck of a lot easier to read! :]
Verifying Spinners
Spinners were particularly worrying — no user wants to waste five seconds of their life staring at a spinner. What does Pulse.io say about the end result of your spinner improvements?
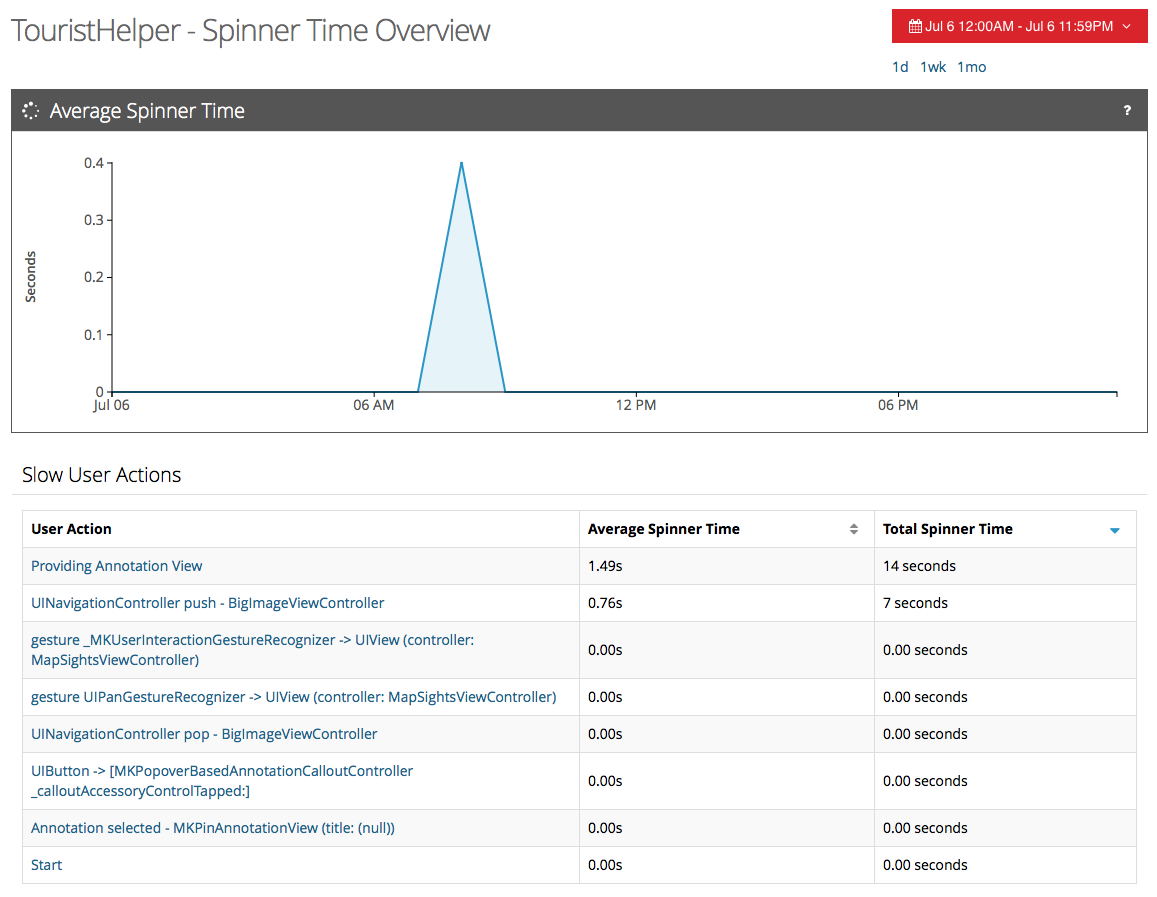
The total spinner time is now 14 seconds, and average spinner time has dropped somewhat but not as dramatically as you might first think. Does that mean your improvements had no effect on average spinner time? How should you interpret these results?
You made two huge reductions to spinner time in the code: first, the new version of the app is making requests for thumbnail (small) images at about the same rate as the first version, but deferring the fetch of the large images to when the user taps on the thumbnail.
Second, you switched the route calculation to a much more sensible next-closest algorithm and only perform it once per set of points.
So the cost of bringing up a spinner and performing an operation has dropped, on average, as you're requesting smaller pieces of data, but the total number of spinners displayed has dropped dramatically as you're making far fewer image requests.
What was that previous result again?
![]()
Yep - that's a huge improvement; the app is now much more usable.
Although you've achieved some success with your spinner time, you really should aim to avoid any spinner time at all.
One possible way to cut down on spinner use in your app is to make the initial image request to Flickr and display the points on the map immediately. The route calculation would be performed in the background and leave the UI thread responsive so the user can interact with the map. You would then display the calculated route once the algorithm was done.
This would be a great change to attempt on your own to see the effect it has on spinner use. If you do choose to try this, please share your before and after performance results in the forum discussion below!
All that's left to check on is the frame rate issue that you solved by re-using annotations. What did Pulse.io detect as your improved frame rate?